
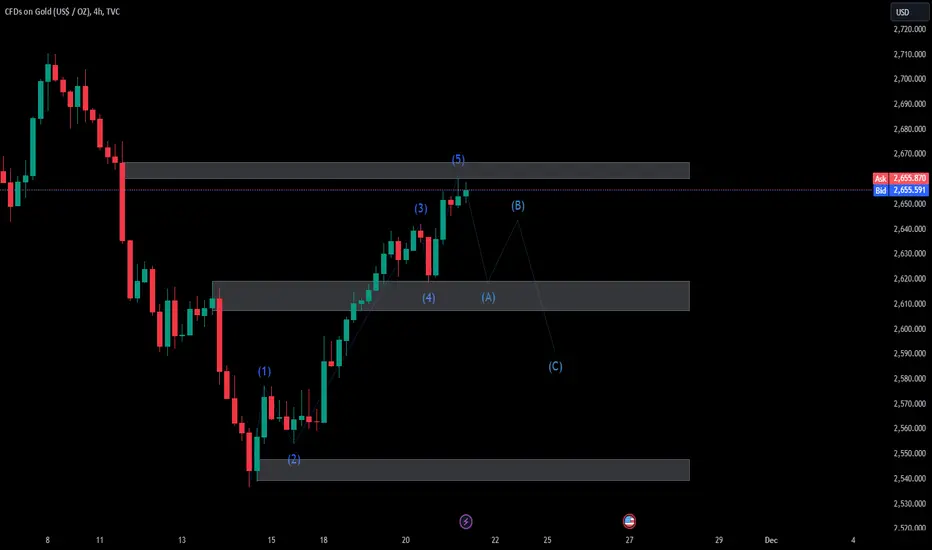
The 4-hour XAU/USD chart shows a completed Elliott Wave (1-5) structure, with wave (5) reaching the $2,655-$2,660 resistance zone, indicating a potential reversal. A corrective ABC pattern is expected:
As gold prices are highly sensitive to macroeconomic events, traders should use proper position sizing and stop-loss levels to mitigate risks. Keep an eye on upcoming economic releases and geopolitical tensions that might affect market volatility.
Good luck
- Wave A: Targeting $2,620-$2,630 (middle support zone).
- Wave B: Minor retracement below $2,655.
- Wave C: Extending to $2,600-$2,610 (lower support).
As gold prices are highly sensitive to macroeconomic events, traders should use proper position sizing and stop-loss levels to mitigate risks. Keep an eye on upcoming economic releases and geopolitical tensions that might affect market volatility.
Good luck
บันทึก
Update new resistance: การซื้อขายยังคงดำเนินอยู่
now price hit resistance so wait drop to make wave A :) but if It break up resistance so find your stop loss
good luck :)
ปิดการเทรด: ถึงเป้าหมายการตัดขาดทุน

การนำเสนอที่เกี่ยวข้อง
คำจำกัดสิทธิ์ความรับผิดชอบ
ข้อมูลและบทความไม่ได้มีวัตถุประสงค์เพื่อก่อให้เกิดกิจกรรมทางการเงิน, การลงทุน, การซื้อขาย, ข้อเสนอแนะ หรือคำแนะนำประเภทอื่น ๆ ที่ให้หรือรับรองโดย TradingView อ่านเพิ่มเติมใน ข้อกำหนดการใช้งาน
การนำเสนอที่เกี่ยวข้อง
คำจำกัดสิทธิ์ความรับผิดชอบ
ข้อมูลและบทความไม่ได้มีวัตถุประสงค์เพื่อก่อให้เกิดกิจกรรมทางการเงิน, การลงทุน, การซื้อขาย, ข้อเสนอแนะ หรือคำแนะนำประเภทอื่น ๆ ที่ให้หรือรับรองโดย TradingView อ่านเพิ่มเติมใน ข้อกำหนดการใช้งาน