
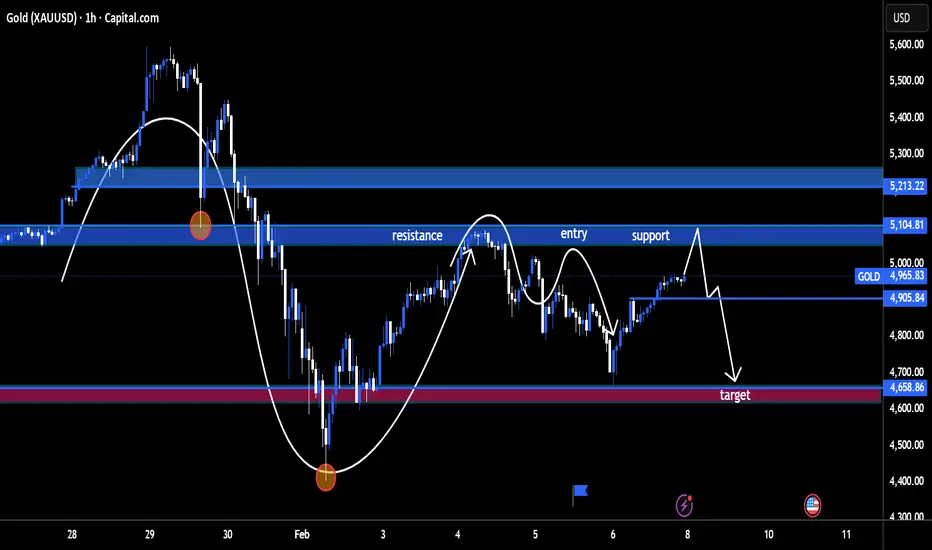
Here’s a clean breakdown of what this chart is saying 👇
Market Structure
Gold is still in a broader bearish structure.
We saw a strong impulsive sell-off, followed by a corrective bounce (classic dead-cat / pullback move).
The white curved paths you marked show lower highs forming, which keeps sellers in control.
🧱 Key Zones
Major Resistance Zone: ~5,105 – 5,213
This area previously acted as support → broke down → now acting as supply.
Entry / Minor Resistance: ~5,000 – 5,050
Price is currently reacting here. This is where sellers are expected to step in.
Near-Term Support: ~4,905
A minor reaction level, but not strong enough to flip trend.
Primary Target / Demand Zone: ~4,658
Strong historical demand + prior reaction low. Logical downside objective.
📉 Price Action Read
The bounce from ~4,700 looks corrective, not impulsive.
Momentum weakens as price approaches resistance → bearish continuation likely.
The projected spike above resistance followed by a sharp drop suggests liquidity grab before the sell-off.
🎯 Trade Bias (Based on the Chart)
Bias: Bearish
Ideal Play:
Sell rejection from 5,000 – 5,100
Confirmation via bearish candles / lower-timeframe rejection
Target: 4,660 demand zone
Invalidation: Clean acceptance above ~5,213
🧠 Big Picture Takeaway
This is a pullback into resistance within a downtrend, not a trend reversal. Unless gold reclaims and holds above the upper resistance zone, rallies are likely selling opportunities, not buys.
การซื้อขายยังคงดำเนินอยู่

คำจำกัดสิทธิ์ความรับผิดชอบ
ข้อมูลและบทความไม่ได้มีวัตถุประสงค์เพื่อก่อให้เกิดกิจกรรมทางการเงิน, การลงทุน, การซื้อขาย, ข้อเสนอแนะ หรือคำแนะนำประเภทอื่น ๆ ที่ให้หรือรับรองโดย TradingView อ่านเพิ่มเติมใน ข้อกำหนดการใช้งาน
คำจำกัดสิทธิ์ความรับผิดชอบ
ข้อมูลและบทความไม่ได้มีวัตถุประสงค์เพื่อก่อให้เกิดกิจกรรมทางการเงิน, การลงทุน, การซื้อขาย, ข้อเสนอแนะ หรือคำแนะนำประเภทอื่น ๆ ที่ให้หรือรับรองโดย TradingView อ่านเพิ่มเติมใน ข้อกำหนดการใช้งาน