
Gold – Complex Head & Shoulders Setup - 2 hours
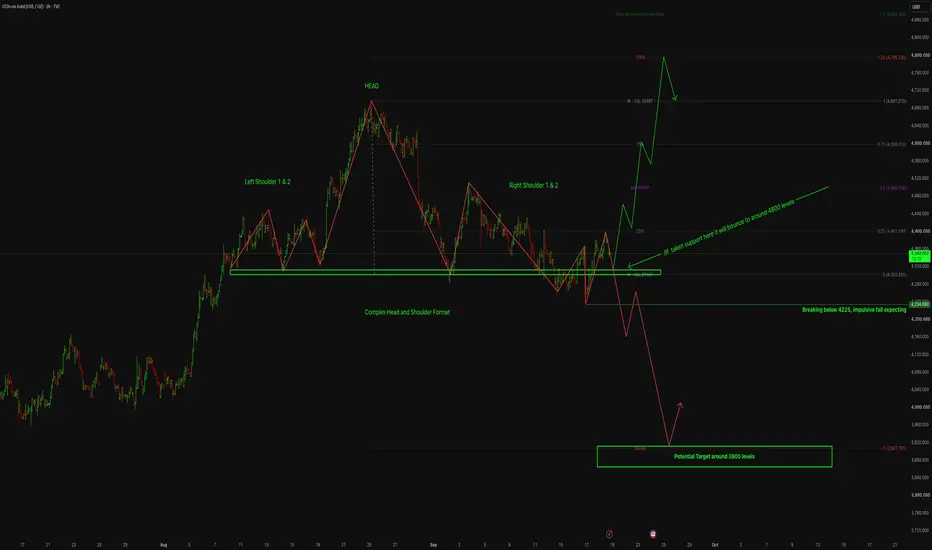
The chart shows a potential complex Head & Shoulders formation, with the neckline/support zone around 4,300–4,320 acting as the key decision area.
Gold is currently trading above this support, and if the zone continues to hold, the chart suggests a possible bounce toward 4,480, followed by higher levels around 4,600–4,700.
The bullish scenario strengthens if price sustains above the neckline and develops higher highs.
On the other hand, a decisive break below 4,225 could invalidate the bullish recovery scenario and potentially trigger an impulsive decline toward the marked 3,900 zone.
Therefore, 4,300–4,320 is the critical support area to watch for confirmation.
Idea Rating: 8.5/10
Disclaimer: This is a technical-analysis idea for educational purposes only and is not financial or investment advice. The projected direction and targets are possible scenarios, not guaranteed outcomes. Please do your own analysis and use appropriate risk management before making any trading decision.
Gold is currently trading above this support, and if the zone continues to hold, the chart suggests a possible bounce toward 4,480, followed by higher levels around 4,600–4,700.
The bullish scenario strengthens if price sustains above the neckline and develops higher highs.
On the other hand, a decisive break below 4,225 could invalidate the bullish recovery scenario and potentially trigger an impulsive decline toward the marked 3,900 zone.
Therefore, 4,300–4,320 is the critical support area to watch for confirmation.
Idea Rating: 8.5/10
Disclaimer: This is a technical-analysis idea for educational purposes only and is not financial or investment advice. The projected direction and targets are possible scenarios, not guaranteed outcomes. Please do your own analysis and use appropriate risk management before making any trading decision.

คำจำกัดสิทธิ์ความรับผิดชอบ
ข้อมูลและบทความไม่ได้มีวัตถุประสงค์เพื่อก่อให้เกิดกิจกรรมทางการเงิน, การลงทุน, การซื้อขาย, ข้อเสนอแนะ หรือคำแนะนำประเภทอื่น ๆ ที่ให้หรือรับรองโดย TradingView อ่านเพิ่มเติมใน ข้อกำหนดการใช้งาน
คำจำกัดสิทธิ์ความรับผิดชอบ
ข้อมูลและบทความไม่ได้มีวัตถุประสงค์เพื่อก่อให้เกิดกิจกรรมทางการเงิน, การลงทุน, การซื้อขาย, ข้อเสนอแนะ หรือคำแนะนำประเภทอื่น ๆ ที่ให้หรือรับรองโดย TradingView อ่านเพิ่มเติมใน ข้อกำหนดการใช้งาน