
Are We Falling into a War Trap? Gold Weekly Analysis March 9–13
The global gold market is currently navigating one of its most confusing periods in recent memory. While traditional textbooks suggest that geopolitical conflict and poor economic data should catapult gold to new heights, the reality on the charts is telling a different, more cautious story.
Are we falling into a "war trap," or is the market simply catching its breath before a massive move? Let's dive into the details.
The NFP Shock vs. Market Reality
Last Friday (March 6), the U.S. Labor Market report delivered a massive blow. The Non-Farm Employment Change came in at a staggering -92K, far below the forecasted 58K. Simultaneously, the Unemployment Rate ticked up to 4.4%.
On paper, this is a disaster for the U.S. Dollar and a "buy" signal for Gold. Initially, we saw a positive reaction, with gold pushing higher. However, the Monday morning opening told a different story—a significant drop that wiped out those gains. This "fake-out" suggests that despite the terrible economic data, the market is struggling to maintain a bullish bias.
The Iran-US Conflict: A Double-Edged Sword
Since the onset of the Iran-U.S. conflict, gold has behaved unpredictably. Usually, war equals a safe-haven rally. However, after a brief 100% "by the book" move on day one, the momentum fizzled out.
Interestingly, while oil prices have been climbing—which usually drags gold up due to inflation fears—gold has been swimming against the tide for the last nine days. This suggests that investors might be prioritizing liquidity over safety. Many appear to be holding cash, fearing that at current levels, gold is simply "overpriced."
The Great Divergence: East vs. West
A fascinating trend has emerged over the past few months:
The Asian Session: Consistently shows buying pressure, holding the price up.
European & American Sessions: We see a recurring tendency to sell off.
This indicates a clear divide in sentiment. Asian investors still view gold as a necessary hedge, while Western institutional investors seem to believe the current rates are unsustainable, leading to aggressive selling during their trading hours.
Macro Outlook & Inflation
With no major U.S. macro reports scheduled for this week, the spotlight remains firmly on the Iran-U.S. war and Price Action.
One critical factor to watch is inflation. As oil prices rise due to the conflict, the hope for central banks to cut interest rates is fading fast. Higher-for-longer rates are generally a headwind for gold, which might explain why the $5,200–$5,220 resistance zone feels like an unbreakable ceiling right now.
Technical Outlook: The Levels to Watch
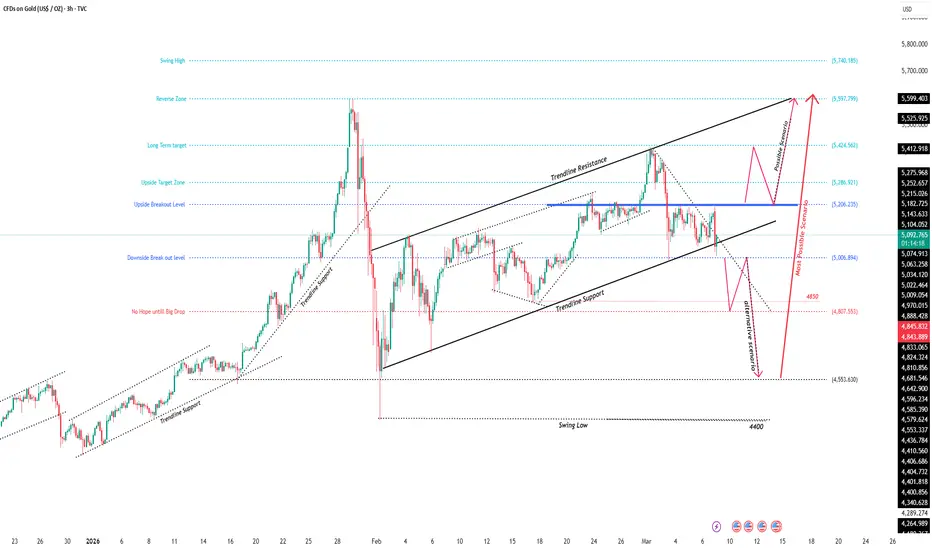
Technically, the bias is leaning toward the bearish side in the short term. As of writing, Gold is hovering around the $5,080 area, having dropped from the $5,200 open to a low of $5,016.
Support Zones:
$5,000 (Major Psychological Support): This is the line in the sand. Gold has pulled back from here before. As long as we stay above $5,000, there is still hope for the bulls.
$4,850 – $4,800: If $5,000 breaks, expect a swift drop to this zone.
$4,550 – $4,400 (The Floor): This is our final downside target. Unless the war ends abruptly, I personally do not see gold falling below the $4,400 mark.
Resistance Zones:
$5,200 – $5,220: The primary obstacle. We need a stable daily close above this to shift back into a long-term "Buy Mode."
$5,280 – $5,300: The next target after a breakout.
$5,400 – $5,420: Mid-term resistance.
$5,590 – $5,600: The final upside target for this cycle.
Trading Strategy
For the upcoming week, my approach is cautiously bullish during the Asian session but extremely defensive during the American session.
Buy on Dips: Look for buying opportunities at major support levels.
Monitor the Breakout: If $5,220 is breached, the liquidity crunch will likely ease, potentially triggering a long-term rally toward $5,600 or even $6,000.
Risk Management: Given the "War Trap" environment, Stop Losses and Money Management are not optional—they are your only protection against unpredictable market swings.
Bottom Line: Don't get caught in the trap. Trade what you see on the charts, not just what you hear in the news.
Are we falling into a "war trap," or is the market simply catching its breath before a massive move? Let's dive into the details.
The NFP Shock vs. Market Reality
Last Friday (March 6), the U.S. Labor Market report delivered a massive blow. The Non-Farm Employment Change came in at a staggering -92K, far below the forecasted 58K. Simultaneously, the Unemployment Rate ticked up to 4.4%.
On paper, this is a disaster for the U.S. Dollar and a "buy" signal for Gold. Initially, we saw a positive reaction, with gold pushing higher. However, the Monday morning opening told a different story—a significant drop that wiped out those gains. This "fake-out" suggests that despite the terrible economic data, the market is struggling to maintain a bullish bias.
The Iran-US Conflict: A Double-Edged Sword
Since the onset of the Iran-U.S. conflict, gold has behaved unpredictably. Usually, war equals a safe-haven rally. However, after a brief 100% "by the book" move on day one, the momentum fizzled out.
Interestingly, while oil prices have been climbing—which usually drags gold up due to inflation fears—gold has been swimming against the tide for the last nine days. This suggests that investors might be prioritizing liquidity over safety. Many appear to be holding cash, fearing that at current levels, gold is simply "overpriced."
The Great Divergence: East vs. West
A fascinating trend has emerged over the past few months:
The Asian Session: Consistently shows buying pressure, holding the price up.
European & American Sessions: We see a recurring tendency to sell off.
This indicates a clear divide in sentiment. Asian investors still view gold as a necessary hedge, while Western institutional investors seem to believe the current rates are unsustainable, leading to aggressive selling during their trading hours.
Macro Outlook & Inflation
With no major U.S. macro reports scheduled for this week, the spotlight remains firmly on the Iran-U.S. war and Price Action.
One critical factor to watch is inflation. As oil prices rise due to the conflict, the hope for central banks to cut interest rates is fading fast. Higher-for-longer rates are generally a headwind for gold, which might explain why the $5,200–$5,220 resistance zone feels like an unbreakable ceiling right now.
Technical Outlook: The Levels to Watch
Technically, the bias is leaning toward the bearish side in the short term. As of writing, Gold is hovering around the $5,080 area, having dropped from the $5,200 open to a low of $5,016.
Support Zones:
$5,000 (Major Psychological Support): This is the line in the sand. Gold has pulled back from here before. As long as we stay above $5,000, there is still hope for the bulls.
$4,850 – $4,800: If $5,000 breaks, expect a swift drop to this zone.
$4,550 – $4,400 (The Floor): This is our final downside target. Unless the war ends abruptly, I personally do not see gold falling below the $4,400 mark.
Resistance Zones:
$5,200 – $5,220: The primary obstacle. We need a stable daily close above this to shift back into a long-term "Buy Mode."
$5,280 – $5,300: The next target after a breakout.
$5,400 – $5,420: Mid-term resistance.
$5,590 – $5,600: The final upside target for this cycle.
Trading Strategy
For the upcoming week, my approach is cautiously bullish during the Asian session but extremely defensive during the American session.
Buy on Dips: Look for buying opportunities at major support levels.
Monitor the Breakout: If $5,220 is breached, the liquidity crunch will likely ease, potentially triggering a long-term rally toward $5,600 or even $6,000.
Risk Management: Given the "War Trap" environment, Stop Losses and Money Management are not optional—they are your only protection against unpredictable market swings.
Bottom Line: Don't get caught in the trap. Trade what you see on the charts, not just what you hear in the news.

Forex Signals:
Youtube:
youtube.com/channel/UCMRAU6KDZOro-KmFFSKlfYA
Linkedin:
linkedin.com/company/investor-tipster
Website:
investortipster.com/
Youtube:
youtube.com/channel/UCMRAU6KDZOro-KmFFSKlfYA
Linkedin:
linkedin.com/company/investor-tipster
Website:
investortipster.com/
การนำเสนอที่เกี่ยวข้อง
คำจำกัดสิทธิ์ความรับผิดชอบ
ข้อมูลและบทความไม่ได้มีวัตถุประสงค์เพื่อก่อให้เกิดกิจกรรมทางการเงิน, การลงทุน, การซื้อขาย, ข้อเสนอแนะ หรือคำแนะนำประเภทอื่น ๆ ที่ให้หรือรับรองโดย TradingView อ่านเพิ่มเติมใน ข้อกำหนดการใช้งาน
Forex Signals:
Youtube:
youtube.com/channel/UCMRAU6KDZOro-KmFFSKlfYA
Linkedin:
linkedin.com/company/investor-tipster
Website:
investortipster.com/
Youtube:
youtube.com/channel/UCMRAU6KDZOro-KmFFSKlfYA
Linkedin:
linkedin.com/company/investor-tipster
Website:
investortipster.com/
การนำเสนอที่เกี่ยวข้อง
คำจำกัดสิทธิ์ความรับผิดชอบ
ข้อมูลและบทความไม่ได้มีวัตถุประสงค์เพื่อก่อให้เกิดกิจกรรมทางการเงิน, การลงทุน, การซื้อขาย, ข้อเสนอแนะ หรือคำแนะนำประเภทอื่น ๆ ที่ให้หรือรับรองโดย TradingView อ่านเพิ่มเติมใน ข้อกำหนดการใช้งาน