
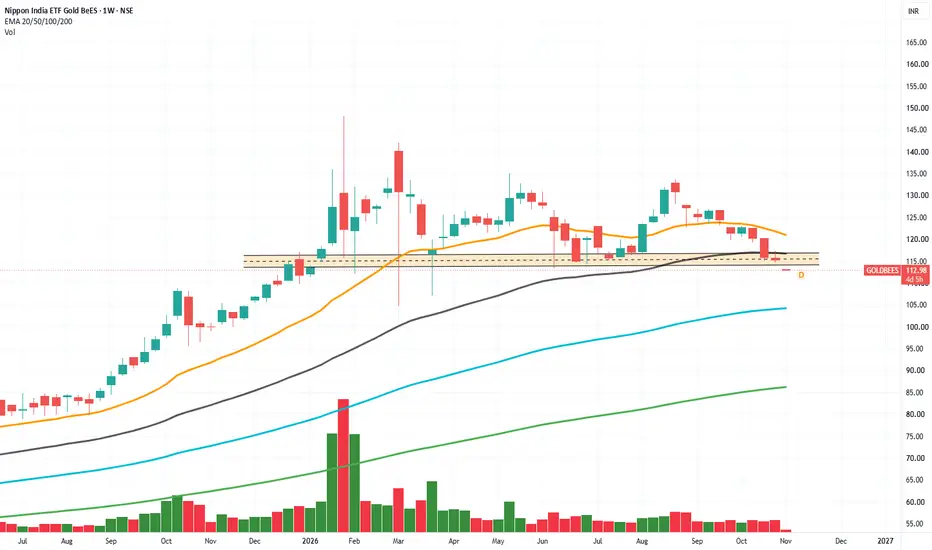
🥇 GOLD BEES: GOLDEN OPPORTUNITY OR WARNING SIGN? 22% BELOW ITS PEAK — WHAT SHOULD INVESTORS DO NOW?
Is this a temporary correction offering an accumulation opportunity, or could gold prices fall further?
Let's examine the historical performance, technical indicators and important price levels.
📊 1. WHERE DOES GOLDBEES STAND?
Long-term performance
Despite the recent correction, GoldBeES has delivered impressive historical returns. However, past performance does not guarantee future returns.
📉 2. WHY HAS GOLDBEES CORRECTED?
🔍 3. TECHNICAL INDICATORS: WHAT IS THE CHART SAYING?
Bollinger Bands
Other indicators
🎯 4. IMPORTANT SUPPORT & RESISTANCE LEVELS
🟢Support zones
🔴Resistance zones
These are approximate technical reference levels, not guaranteed price turning points.
📈 5. WHAT COULD HAPPEN NEXT?
Scenario 1: Bullish recovery
Scenario 2: Further correction
Scenario 3: Long-term accumulation
🌍 6. WHAT SHOULD GOLD INVESTORS WATCH?
💡 FINAL INVESTOR TAKEAWAY
The golden rule: Don't confuse a correction with the end of a long-term investment story—but don't assume every fall is a buying opportunity either.
📌 Watch ₹114.50 support and ₹119 resistance closely. The next directional move could provide important clues about GoldBeES's short-term trend.
#GoldBeES #GOLDBEES #GoldETF #GoldInvestment #GoldPrice #NipponIndiaETF #StockMarketIndia #TechnicalAnalysis #PortfolioDiversification #Investing #TradingView
*Disclaimer: For educational purposes only. Not a buy/sell recommendation. Consider your investment horizon, asset allocation and risk tolerance before investing.*
- Gold has been one of the biggest wealth-preservation stories over recent years.
- However, even gold is not immune to sharp corrections.
- After reaching a 52-week high of ₹148.14 in January 2026, GoldBeES has corrected significantly and is now showing signs of short-term weakness.
Is this a temporary correction offering an accumulation opportunity, or could gold prices fall further?
Let's examine the historical performance, technical indicators and important price levels.
📊 1. WHERE DOES GOLDBEES STAND?
- Latest closing price:₹115.23 (30 October 2026).
- 52-week high:₹148.14.
- 52-week low:Approximately ₹99.03 (some data providers report ₹97.30).
- Correction from the high:Approximately 22.2%.
- Recovery from the 52-week low:Approximately 16.3%.
Long-term performance
- 1-year return: Approximately +15.2%.
- 3-year return: Approximately +125.4%.
- 5-year return: Approximately +179.9%.
- 10-year return: Approximately +318%.
Despite the recent correction, GoldBeES has delivered impressive historical returns. However, past performance does not guarantee future returns.
📉 2. WHY HAS GOLDBEES CORRECTED?
- Several global factors have influenced the recent weakness in gold:
- Stronger US dollar: A stronger dollar can make internationally priced gold more expensive for buyers using other currencies.
- Higher US Treasury yields: Rising yields can reduce gold's relative attractiveness because gold does not generate interest income.
- Profit-booking: After a substantial rally, investors may choose to book profits.
- Reduced futures positioning: Changes in speculative positions can accelerate short-term price movements.
- Global market uncertainty: Geopolitical developments and changing monetary-policy expectations can cause sharp fluctuations in safe-haven demand.
- According to the World Gold Council's October 2026 update, international gold prices declined approximately 8.5% in September, while domestic gold prices fell around 4.8%.
- Nevertheless, gold ETF inflows remained positive through mid-October, indicating that investor interest had not completely disappeared.
🔍 3. TECHNICAL INDICATORS: WHAT IS THE CHART SAYING?
- Moving Averages – Short-term trend remains weak
- 20-day EMA: ₹118.79.
- 50-day EMA: ₹121.14.
- 100-day EMA: ₹121.83.
- 200-day EMA: ₹118.77.
- Current price is below all these moving averages.
- The ₹119–₹124 region represents an important resistance cluster.
- RSI (14): Approximately 31.18
- Momentum is weak and approaching oversold territory.
- A short-term relief rally is possible.
- A move above 40 could be an initial indication of improving momentum.
- An oversold RSI does not guarantee that prices have reached their bottom.
- MACD: Approximately −2.03
- Negative MACD indicates bearish momentum.
- The indicator remains below its signal line in the available technical snapshot.
- A bullish crossover supported by improving price and volume would strengthen the recovery outlook.
Bollinger Bands
- Upper band: ₹123.84.
- Middle band: ₹119.15.
- Lower band: ₹114.46.
- GoldBeES is trading close to its lower Bollinger Band, indicating weakness relative to its recent price range.
- A recovery from this region is possible, but continued movement below the lower band would be a warning sign.
Other indicators
- ATR (14): Approximately ₹1.38, indicating meaningful daily price fluctuations.
- ADX (14): Approximately 32.68, suggesting an established trend.
- MFI: Approximately 23.73, indicating weak money flow.
🎯 4. IMPORTANT SUPPORT & RESISTANCE LEVELS
🟢Support zones
- ₹114.50–₹115: Immediate support.
- ₹114–₹114.10: Secondary support reference.
- ₹113.40–₹113.50: Next downside reference.
🔴Resistance zones
- ₹115.80–₹116: Immediate resistance.
- ₹116.50–₹117.20: Short-term recovery hurdle.
- ₹118.70–₹119.20: Major moving-average resistance.
- ₹121–₹124: Strong resistance cluster.
- ₹135–₹148: Higher historical resistance zone.
These are approximate technical reference levels, not guaranteed price turning points.
📈 5. WHAT COULD HAPPEN NEXT?
Scenario 1: Bullish recovery
- GoldBeES holds ₹114.50–₹115.
- RSI begins recovering.
- Price moves above ₹117 with sustained buying.
- A stronger move above ₹119–₹121 could improve the technical outlook.
- A breakout above ₹124 would provide more convincing evidence of recovery.
Scenario 2: Further correction
- Price breaks below ₹114.50.
- Selling pressure increases.
- The next support references become ₹114 and ₹113.40.
- Persistent weakness could require investors to reassess their near-term expectations.
Scenario 3: Long-term accumulation
- Investors seeking gold exposure may consider staggered allocation instead of investing the entire amount at once.
- Monitor international gold prices, USD/INR and the ETF's premium or discount to indicative NAV.
- Maintain gold as part of a diversified portfolio rather than treating it as a guaranteed alternative to equities.
🌍 6. WHAT SHOULD GOLD INVESTORS WATCH?
- US dollar movement and Treasury yields.
- Federal Reserve interest-rate expectations.
- Global geopolitical developments.
- Central-bank gold purchases.
- Gold ETF inflows and outflows.
- Indian jewellery demand and seasonal buying.
- Rupee movement against the US dollar.
- These factors can influence both international gold prices and domestic GoldBeES performance.
💡 FINAL INVESTOR TAKEAWAY
- GoldBeES is approximately 22% below its 52-week high, but its short-term technical trend remains bearish.
- The RSI is approaching oversold territory, and the ETF is trading near its lower Bollinger Band. These conditions may create the possibility of a relief rally, but the moving averages and MACD have not yet confirmed a reversal.
- For long-term investors, gold may continue to serve as a portfolio-diversification asset. For short-term traders, confirmation above ₹117 and subsequently ₹119–₹124 would be important.
The golden rule: Don't confuse a correction with the end of a long-term investment story—but don't assume every fall is a buying opportunity either.
📌 Watch ₹114.50 support and ₹119 resistance closely. The next directional move could provide important clues about GoldBeES's short-term trend.
#GoldBeES #GOLDBEES #GoldETF #GoldInvestment #GoldPrice #NipponIndiaETF #StockMarketIndia #TechnicalAnalysis #PortfolioDiversification #Investing #TradingView
*Disclaimer: For educational purposes only. Not a buy/sell recommendation. Consider your investment horizon, asset allocation and risk tolerance before investing.*

คำจำกัดสิทธิ์ความรับผิดชอบ
ข้อมูลและบทความไม่ได้มีวัตถุประสงค์เพื่อก่อให้เกิดกิจกรรมทางการเงิน, การลงทุน, การซื้อขาย, ข้อเสนอแนะ หรือคำแนะนำประเภทอื่น ๆ ที่ให้หรือรับรองโดย TradingView อ่านเพิ่มเติมใน ข้อกำหนดการใช้งาน
คำจำกัดสิทธิ์ความรับผิดชอบ
ข้อมูลและบทความไม่ได้มีวัตถุประสงค์เพื่อก่อให้เกิดกิจกรรมทางการเงิน, การลงทุน, การซื้อขาย, ข้อเสนอแนะ หรือคำแนะนำประเภทอื่น ๆ ที่ให้หรือรับรองโดย TradingView อ่านเพิ่มเติมใน ข้อกำหนดการใช้งาน