
Alphabet (Google) stock trades near $339-$343 with a market cap around $4.18 trillion. Recent news features Google expanding its custom AI chip partnership with Marvell Technology, involving stock warrants, alongside market focus on upcoming Nvidia earnings and broad AI infrastructure spending.
Technical Insight:
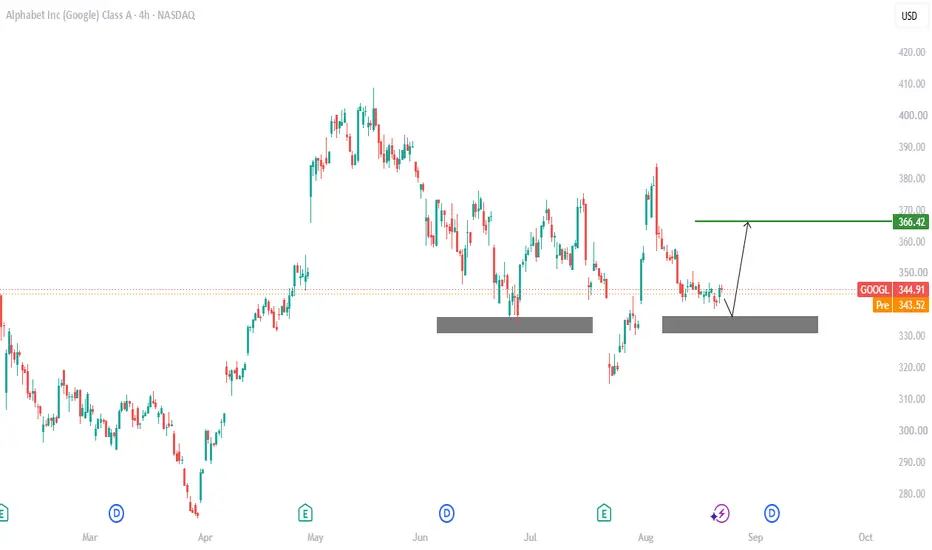
GOOGL is fluctuating on a sell momentum. Stock persists to trend on downward pathway, with lower lows and highs, in concern to the framework. We can spot a partial formation of Inverse Head and Shoulders pattern, as there is fair chance of buy retracement.
Key Point:
A confirmed pullback within this zone, activates a long position to $366, as next possible bullish.
Thanks for reading.
Technical Insight:
GOOGL is fluctuating on a sell momentum. Stock persists to trend on downward pathway, with lower lows and highs, in concern to the framework. We can spot a partial formation of Inverse Head and Shoulders pattern, as there is fair chance of buy retracement.
Key Point:
A confirmed pullback within this zone, activates a long position to $366, as next possible bullish.
Thanks for reading.
การซื้อขายยังคงดำเนินอยู่
GOOGL is still moving as predicted!Stay tune.

คำจำกัดสิทธิ์ความรับผิดชอบ
ข้อมูลและบทความไม่ได้มีวัตถุประสงค์เพื่อก่อให้เกิดกิจกรรมทางการเงิน, การลงทุน, การซื้อขาย, ข้อเสนอแนะ หรือคำแนะนำประเภทอื่น ๆ ที่ให้หรือรับรองโดย TradingView อ่านเพิ่มเติมใน ข้อกำหนดการใช้งาน
คำจำกัดสิทธิ์ความรับผิดชอบ
ข้อมูลและบทความไม่ได้มีวัตถุประสงค์เพื่อก่อให้เกิดกิจกรรมทางการเงิน, การลงทุน, การซื้อขาย, ข้อเสนอแนะ หรือคำแนะนำประเภทอื่น ๆ ที่ให้หรือรับรองโดย TradingView อ่านเพิ่มเติมใน ข้อกำหนดการใช้งาน