The Graph: Updated
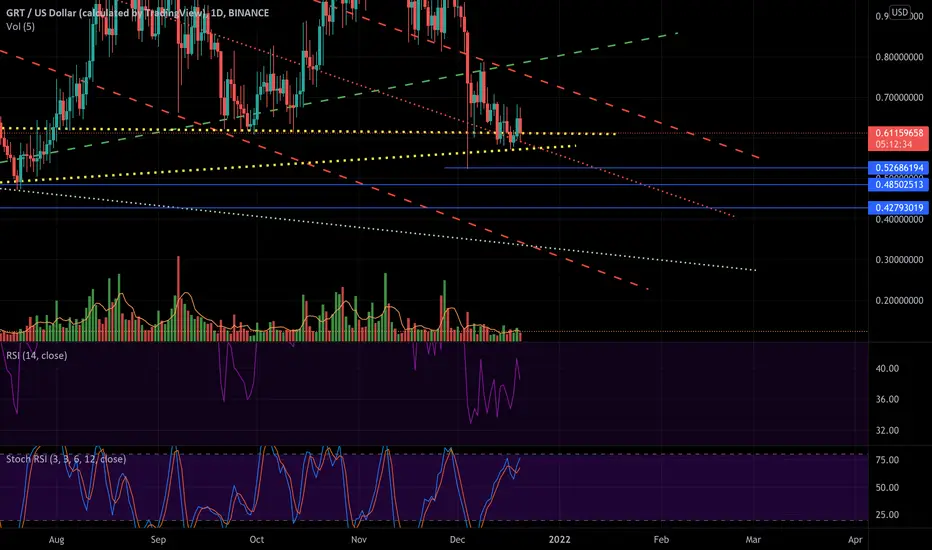
I should have included price levels from previous sell-offs earlier this year (horizontal Blue lines). Original post linked below.
It’s interesting to note that these Blue lines fro previous sell-off intersect our trend-channel early next year. We’ll see if they actually have a “tale” to tell (at the “tail” of the channel) or not (in which case, they’re just a bunch of lines).
It’s interesting to note that these Blue lines fro previous sell-off intersect our trend-channel early next year. We’ll see if they actually have a “tale” to tell (at the “tail” of the channel) or not (in which case, they’re just a bunch of lines).

การนำเสนอที่เกี่ยวข้อง
คำจำกัดสิทธิ์ความรับผิดชอบ
ข้อมูลและบทความไม่ได้มีวัตถุประสงค์เพื่อก่อให้เกิดกิจกรรมทางการเงิน, การลงทุน, การซื้อขาย, ข้อเสนอแนะ หรือคำแนะนำประเภทอื่น ๆ ที่ให้หรือรับรองโดย TradingView อ่านเพิ่มเติมใน ข้อกำหนดการใช้งาน
การนำเสนอที่เกี่ยวข้อง
คำจำกัดสิทธิ์ความรับผิดชอบ
ข้อมูลและบทความไม่ได้มีวัตถุประสงค์เพื่อก่อให้เกิดกิจกรรมทางการเงิน, การลงทุน, การซื้อขาย, ข้อเสนอแนะ หรือคำแนะนำประเภทอื่น ๆ ที่ให้หรือรับรองโดย TradingView อ่านเพิ่มเติมใน ข้อกำหนดการใช้งาน