
📊 HAL – STWP Equity Snapshot
Ticker: NSE: HAL
Sector: ✈️ Defence / Aerospace
CMP: 4,624.00 ▲ (+6.34% | 29 Jan 2026)
Learning Rating: ⭐⭐⭐⭐☆ (Neutral–Range with Breakout Attempt)
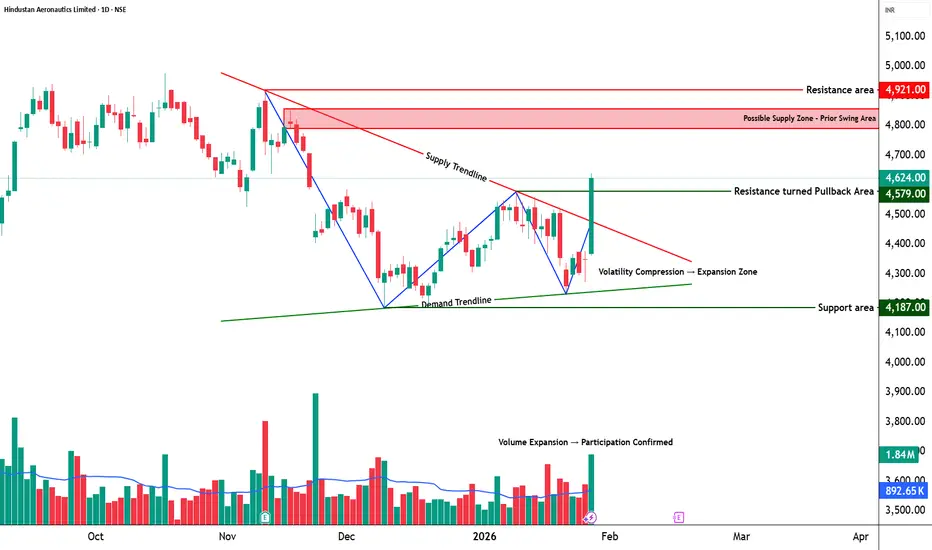
Chart Pattern Observed: 🔺 Descending Triangle (Compression Phase)
Candlestick Pattern Observed: Strong Bullish Marubozu (Breakout Attempt)
📊 Technical Snapshot
HAL has been trading within a descending triangle structure, marked by a sequence of lower highs pressing against a rising demand base — a classic compression setup. The recent session produced a strong bullish Marubozu candle, indicating aggressive buying interest emerging from the demand zone and an initial attempt to resolve the triangle to the upside. RSI is positioned near the higher-mid zone, reflecting improving momentum without entering exhaustion territory. Stochastic has moved out of the lower range, supporting a recovery phase rather than a mature trend. Bollinger Bands remain moderately wide, suggesting volatility expansion post-compression. MACD shows early improvement but remains in a developing phase, implying momentum is building, not fully confirmed yet. Price has also moved closer to the CPR zone; sustained acceptance above the triangle’s upper boundary and CPR pivot would be critical to validate continuation beyond the range.
📊 Volume Analysis
🔹 Current Volume: ~1.84M
🔹 Average Volume (20-period): ~0.89M ✅
💥 Volume is running at more than 2× the recent average, confirming strong participation during the breakout attempt.
💡 Interpretation: Elevated volume emerging from a compressed triangle structure strengthens the probability of directional resolution. However, continuation will require consistent volume support near overhead resistance zones.
🔑 Key Levels – Daily Timeframe
Support Areas: 4444 | 4264 | 4167
Resistance Areas: 4721 | 4818 | 4998
These are zones where price has paused or reacted earlier.
What’s Catching Our Eye: Triangle compression resolving with strong bullish participation.
What to Watch For: Acceptance above triangle resistance and CPR pivot.
Failure Zone: Breakdown below the rising demand trendline.
Risks to Watch: Overhead supply near upper range resistance.
What to Expect Next: Range expansion with directional clarity pending confirmation.
Bullish Case: Sustained acceptance above triangle may trigger trend continuation.
Bearish Case: Rejection at resistance can pull price back into range.
Momentum Case: Strong breakout momentum, needs follow-through.
STWP Price Levels – Educational View
Intraday Setup:
Trigger Zone: 4,624
Invalidation Level: 4,265
Reference 1: 4,721
Reference 2: 4,818
Swing Setup (Hybrid Model – 2–5 days):
Trigger Zone: 4,624
Invalidation Level: 4,167
Reference 1: 4,998
Reference 2: 5,200 (Range Projection)
STWP View:
Momentum: Strong | Trend: Range → Breakout Attempt | Risk: High | Volume: High
Learning Note:
Triangle patterns reward patience — confirmation matters more than anticipation.
Disclaimer:
Educational view only. Not a recommendation. Please consult a SEBI-registered advisor before making any trading or investment decision. STWP is not responsible for actions taken based on this post.
💬 Did this help you read the chart better?
🔼 Boost | ✍️ Comment | 🔁 Share with a learner
👉 Follow STWP for clean chart-reading insights
🚀 Stay Calm. Stay Clean. Trade With Patience.
Ticker: NSE: HAL
Sector: ✈️ Defence / Aerospace
CMP: 4,624.00 ▲ (+6.34% | 29 Jan 2026)
Learning Rating: ⭐⭐⭐⭐☆ (Neutral–Range with Breakout Attempt)
Chart Pattern Observed: 🔺 Descending Triangle (Compression Phase)
Candlestick Pattern Observed: Strong Bullish Marubozu (Breakout Attempt)
📊 Technical Snapshot
HAL has been trading within a descending triangle structure, marked by a sequence of lower highs pressing against a rising demand base — a classic compression setup. The recent session produced a strong bullish Marubozu candle, indicating aggressive buying interest emerging from the demand zone and an initial attempt to resolve the triangle to the upside. RSI is positioned near the higher-mid zone, reflecting improving momentum without entering exhaustion territory. Stochastic has moved out of the lower range, supporting a recovery phase rather than a mature trend. Bollinger Bands remain moderately wide, suggesting volatility expansion post-compression. MACD shows early improvement but remains in a developing phase, implying momentum is building, not fully confirmed yet. Price has also moved closer to the CPR zone; sustained acceptance above the triangle’s upper boundary and CPR pivot would be critical to validate continuation beyond the range.
📊 Volume Analysis
🔹 Current Volume: ~1.84M
🔹 Average Volume (20-period): ~0.89M ✅
💥 Volume is running at more than 2× the recent average, confirming strong participation during the breakout attempt.
💡 Interpretation: Elevated volume emerging from a compressed triangle structure strengthens the probability of directional resolution. However, continuation will require consistent volume support near overhead resistance zones.
🔑 Key Levels – Daily Timeframe
Support Areas: 4444 | 4264 | 4167
Resistance Areas: 4721 | 4818 | 4998
These are zones where price has paused or reacted earlier.
What’s Catching Our Eye: Triangle compression resolving with strong bullish participation.
What to Watch For: Acceptance above triangle resistance and CPR pivot.
Failure Zone: Breakdown below the rising demand trendline.
Risks to Watch: Overhead supply near upper range resistance.
What to Expect Next: Range expansion with directional clarity pending confirmation.
Bullish Case: Sustained acceptance above triangle may trigger trend continuation.
Bearish Case: Rejection at resistance can pull price back into range.
Momentum Case: Strong breakout momentum, needs follow-through.
STWP Price Levels – Educational View
Intraday Setup:
Trigger Zone: 4,624
Invalidation Level: 4,265
Reference 1: 4,721
Reference 2: 4,818
Swing Setup (Hybrid Model – 2–5 days):
Trigger Zone: 4,624
Invalidation Level: 4,167
Reference 1: 4,998
Reference 2: 5,200 (Range Projection)
STWP View:
Momentum: Strong | Trend: Range → Breakout Attempt | Risk: High | Volume: High
Learning Note:
Triangle patterns reward patience — confirmation matters more than anticipation.
Disclaimer:
Educational view only. Not a recommendation. Please consult a SEBI-registered advisor before making any trading or investment decision. STWP is not responsible for actions taken based on this post.
💬 Did this help you read the chart better?
🔼 Boost | ✍️ Comment | 🔁 Share with a learner
👉 Follow STWP for clean chart-reading insights
🚀 Stay Calm. Stay Clean. Trade With Patience.

STWP | Mentor & Demand-Supply Specialist |
Empowering traders through structured learning |
simpletradewithpatience.com
Community: chat.whatsapp.com/BEYz0tkqP0fJPBCWf59uel
wa.me/message/6IOPHGOXMGZ4N1
Educational Only
Empowering traders through structured learning |
simpletradewithpatience.com
Community: chat.whatsapp.com/BEYz0tkqP0fJPBCWf59uel
wa.me/message/6IOPHGOXMGZ4N1
Educational Only
คำจำกัดสิทธิ์ความรับผิดชอบ
ข้อมูลและบทความไม่ได้มีวัตถุประสงค์เพื่อก่อให้เกิดกิจกรรมทางการเงิน, การลงทุน, การซื้อขาย, ข้อเสนอแนะ หรือคำแนะนำประเภทอื่น ๆ ที่ให้หรือรับรองโดย TradingView อ่านเพิ่มเติมใน ข้อกำหนดการใช้งาน
STWP | Mentor & Demand-Supply Specialist |
Empowering traders through structured learning |
simpletradewithpatience.com
Community: chat.whatsapp.com/BEYz0tkqP0fJPBCWf59uel
wa.me/message/6IOPHGOXMGZ4N1
Educational Only
Empowering traders through structured learning |
simpletradewithpatience.com
Community: chat.whatsapp.com/BEYz0tkqP0fJPBCWf59uel
wa.me/message/6IOPHGOXMGZ4N1
Educational Only
คำจำกัดสิทธิ์ความรับผิดชอบ
ข้อมูลและบทความไม่ได้มีวัตถุประสงค์เพื่อก่อให้เกิดกิจกรรมทางการเงิน, การลงทุน, การซื้อขาย, ข้อเสนอแนะ หรือคำแนะนำประเภทอื่น ๆ ที่ให้หรือรับรองโดย TradingView อ่านเพิ่มเติมใน ข้อกำหนดการใช้งาน