
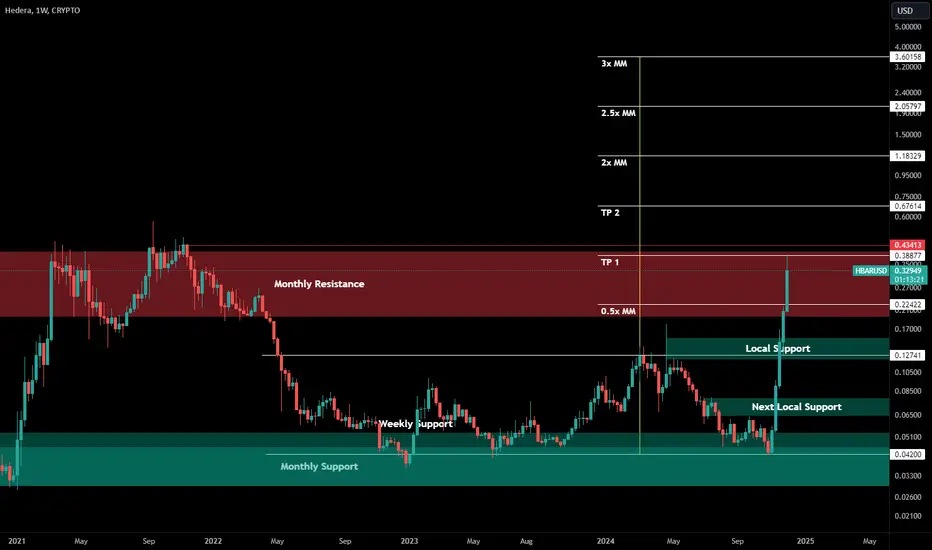
Publishing a monthly support and resistance chart, a weekly view of that chart - with targets - that I've been sharing for a while, so others can follow along.
This in addition to the parallel S/R chart that is already published here:

With an updated snapshot of it here (targets adjusted for where it broke out):

Possible areas of local support if any dips below monthly resistance are marked on the chart.
Hope this helps if you are following HBARUSD
This in addition to the parallel S/R chart that is already published here:
With an updated snapshot of it here (targets adjusted for where it broke out):
Possible areas of local support if any dips below monthly resistance are marked on the chart.
Hope this helps if you are following HBARUSD

คำจำกัดสิทธิ์ความรับผิดชอบ
ข้อมูลและบทความไม่ได้มีวัตถุประสงค์เพื่อก่อให้เกิดกิจกรรมทางการเงิน, การลงทุน, การซื้อขาย, ข้อเสนอแนะ หรือคำแนะนำประเภทอื่น ๆ ที่ให้หรือรับรองโดย TradingView อ่านเพิ่มเติมใน ข้อกำหนดการใช้งาน
คำจำกัดสิทธิ์ความรับผิดชอบ
ข้อมูลและบทความไม่ได้มีวัตถุประสงค์เพื่อก่อให้เกิดกิจกรรมทางการเงิน, การลงทุน, การซื้อขาย, ข้อเสนอแนะ หรือคำแนะนำประเภทอื่น ๆ ที่ให้หรือรับรองโดย TradingView อ่านเพิ่มเติมใน ข้อกำหนดการใช้งาน