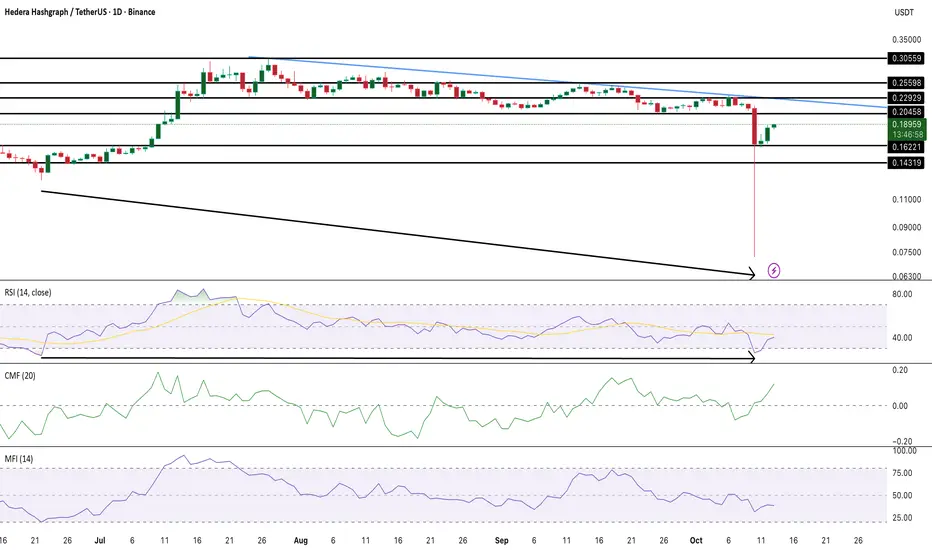

 HBARUSDT's price chart is flashing early bullish signals after a prolonged downtrend. The token has formed a bullish divergence on the Relative Strength Index (RSI) — while price made lower lows between June 22 and October 10, the RSI printed higher lows, hinting that selling momentum is weakening.
The
HBARUSDT structure still sits below a descending trendline, keeping the broader setup fragile. However, a clean breakout above $0.22, a resistance zone that has rejected multiple recovery attempts, would confirm trend reversal. If that happens, targets at $0.25 and $0.30 come into focus.On the downside, $0.16 remains critical support — losing it could send
HBARUSDT toward $0.14, where strong buyer activity was last seen. Overall, fading bearish momentum and improving RSI suggest the market is preparing for an early-stage recovery, with a decisive break above $0.22 acting as the key trigger.
Leader in crypto news, award winning journalism in 26 languages.
คำจำกัดสิทธิ์ความรับผิดชอบ
ข้อมูลและบทความไม่ได้มีวัตถุประสงค์เพื่อก่อให้เกิดกิจกรรมทางการเงิน, การลงทุน, การซื้อขาย, ข้อเสนอแนะ หรือคำแนะนำประเภทอื่น ๆ ที่ให้หรือรับรองโดย TradingView อ่านเพิ่มเติมใน ข้อกำหนดการใช้งาน
Leader in crypto news, award winning journalism in 26 languages.
คำจำกัดสิทธิ์ความรับผิดชอบ
ข้อมูลและบทความไม่ได้มีวัตถุประสงค์เพื่อก่อให้เกิดกิจกรรมทางการเงิน, การลงทุน, การซื้อขาย, ข้อเสนอแนะ หรือคำแนะนำประเภทอื่น ๆ ที่ให้หรือรับรองโดย TradingView อ่านเพิ่มเติมใน ข้อกำหนดการใช้งาน