
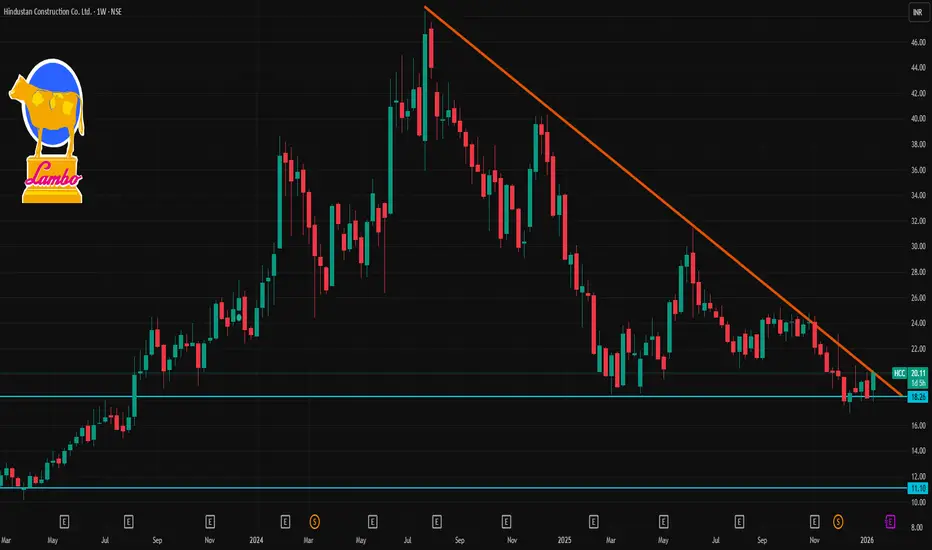
📍 Live Price Snapshot
Approx current price: ~₹18.7–₹19.0 (latest live levels)
📊 1‑Week Technical Levels (Pivot Based)
These levels are useful for short‑term trades this week:
🔹 Weekly Pivot & Resistance
Pivot Point: ₹18.79 (base zone)
R1 (First Resistance): ~₹19.09
R2: ~₹19.56
R3: ~₹19.86
👉 Bullish view: Sustained trade above R1 ~₹19.1–₹19.3 may signal short‑term upside continuation towards R2/R3.
🔻 Weekly Support Levels
S1: ~₹18.32
S2: ~₹18.02
S3: ~₹17.55
👉 Bearish view: A break below S2 ~₹18.0 can open risk toward S3 ~₹17.5.
📌 Short‑Term Trend Indicators
RSI (~neutral): ~46–56 — showing neither strong buy nor oversold pressure currently.
Moving Averages: Price is near short‑term moving averages, but all major mid‑term EMAs/SMAs are above price indicating a bearish bias in broader trend.
Summary of Technical Bias:
Bullish above pivot/R1 (~₹18.8–19.1): Could test R2 ~₹19.5 and R3 ~₹19.8+.
Neutral range: Between ₹18.3–₹19.1.
Bearish below S1/S2 (~₹18.3/₹18.0): Potential move down toward ₹17.5 support.
🧠 Weekly Outlook (Quick Interpret)
✔ Immediate resistance range: ₹19.1–₹19.8
✔ Immediate support range: ₹18.0–₹18.5
✔ Trend context: Short‑term consolidation with a slight bearish edge on broader SMAs; buy setup improves only on clear weekly strength above the pivot/resistance zone.

Contact Knowledgehub for a detailed consultation: Dm on WhatsApp: [wa.link/a2o0kz]-
Phone No: [+91 93102 26243]-
Email: [tradingviewknowledgehub@gmail.com]---
-- Let’s achieve success together!
Phone No: [+91 93102 26243]-
Email: [tradingviewknowledgehub@gmail.com]---
-- Let’s achieve success together!
การนำเสนอที่เกี่ยวข้อง
คำจำกัดสิทธิ์ความรับผิดชอบ
ข้อมูลและบทความไม่ได้มีวัตถุประสงค์เพื่อก่อให้เกิดกิจกรรมทางการเงิน, การลงทุน, การซื้อขาย, ข้อเสนอแนะ หรือคำแนะนำประเภทอื่น ๆ ที่ให้หรือรับรองโดย TradingView อ่านเพิ่มเติมใน ข้อกำหนดการใช้งาน