
🔍 Quick Summary: What’s Priced In?
Despite a solid PAT beat (₹18,160 Cr, +12% YoY), NII missed expectations (only +5% YoY) and margins fell. The profit beat was largely driven by non-core gains (₹9,130 Cr stake sale in HDB Financial). This signals:
Core operations slightly underwhelming
Market may not reward the PAT beat aggressively
Bonus + Dividend is already priced in (price rallied earlier)
📉 Technical & Derivatives Outlook:
🧱 Price Action:
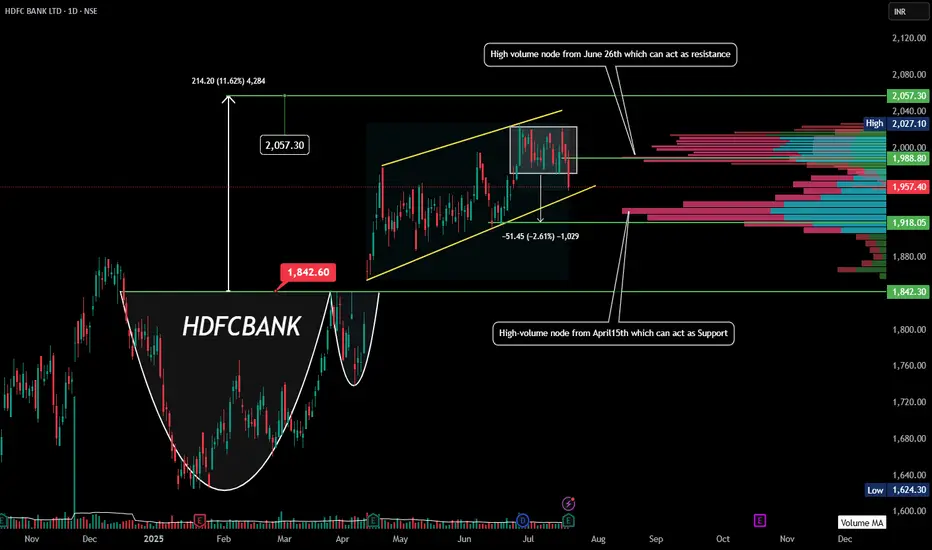
Cup & handle breakout recently happened ✔️
Price is stuck in a channel (as seen on the chart)
Consolidation breakdown on friday -target 1918.75
Facing strong resistance around ₹2000–2040 (High Volume Nodes + OI buildup)
Immediate support: ₹1918–1840 (Volume cluster + previous breakout retest)
🔍 OI Data (as of July 18):
PCR: 0.6 → Bearish bias
Highest Call OI: 2000–2040 CE → Acts as resistance ceiling
Strong Put OI only around 1900–1920 → Weak support zone forming
🔮 Expected Price Action Next Week:
🔻 Bearish to Sideways Bias:
Given weak core NII and resistance zone near ₹2000, stock might consolidate or correct slightly.
If ₹1918 breaks, can test ₹1840 again.
Only a breakout above ₹ 1988 and ₹2040 with volume will revive bullish momentum.
🛡️ Key Levels to Watch:
Direction Key Level Action
Resistance ₹1988–2027 Selling pressure(OI + HVN)
Support ₹1918 Breakdown -₹1840
Strong Sup ₹1840 High volume node + previous breakout
🎯 Conclusion (1-week view):
📉 Slightly bearish / sideways expected
📌 Likely range: ₹1918 – ₹2000. Cmp- 1957
🎯 Bulls need a close above ₹2040 for further upside
Despite a solid PAT beat (₹18,160 Cr, +12% YoY), NII missed expectations (only +5% YoY) and margins fell. The profit beat was largely driven by non-core gains (₹9,130 Cr stake sale in HDB Financial). This signals:
Core operations slightly underwhelming
Market may not reward the PAT beat aggressively
Bonus + Dividend is already priced in (price rallied earlier)
📉 Technical & Derivatives Outlook:
🧱 Price Action:
Cup & handle breakout recently happened ✔️
Price is stuck in a channel (as seen on the chart)
Consolidation breakdown on friday -target 1918.75
Facing strong resistance around ₹2000–2040 (High Volume Nodes + OI buildup)
Immediate support: ₹1918–1840 (Volume cluster + previous breakout retest)
🔍 OI Data (as of July 18):
PCR: 0.6 → Bearish bias
Highest Call OI: 2000–2040 CE → Acts as resistance ceiling
Strong Put OI only around 1900–1920 → Weak support zone forming
🔮 Expected Price Action Next Week:
🔻 Bearish to Sideways Bias:
Given weak core NII and resistance zone near ₹2000, stock might consolidate or correct slightly.
If ₹1918 breaks, can test ₹1840 again.
Only a breakout above ₹ 1988 and ₹2040 with volume will revive bullish momentum.
🛡️ Key Levels to Watch:
Direction Key Level Action
Resistance ₹1988–2027 Selling pressure(OI + HVN)
Support ₹1918 Breakdown -₹1840
Strong Sup ₹1840 High volume node + previous breakout
🎯 Conclusion (1-week view):
📉 Slightly bearish / sideways expected
📌 Likely range: ₹1918 – ₹2000. Cmp- 1957
🎯 Bulls need a close above ₹2040 for further upside

คำจำกัดสิทธิ์ความรับผิดชอบ
ข้อมูลและบทความไม่ได้มีวัตถุประสงค์เพื่อก่อให้เกิดกิจกรรมทางการเงิน, การลงทุน, การซื้อขาย, ข้อเสนอแนะ หรือคำแนะนำประเภทอื่น ๆ ที่ให้หรือรับรองโดย TradingView อ่านเพิ่มเติมใน ข้อกำหนดการใช้งาน
คำจำกัดสิทธิ์ความรับผิดชอบ
ข้อมูลและบทความไม่ได้มีวัตถุประสงค์เพื่อก่อให้เกิดกิจกรรมทางการเงิน, การลงทุน, การซื้อขาย, ข้อเสนอแนะ หรือคำแนะนำประเภทอื่น ๆ ที่ให้หรือรับรองโดย TradingView อ่านเพิ่มเติมใน ข้อกำหนดการใช้งาน