
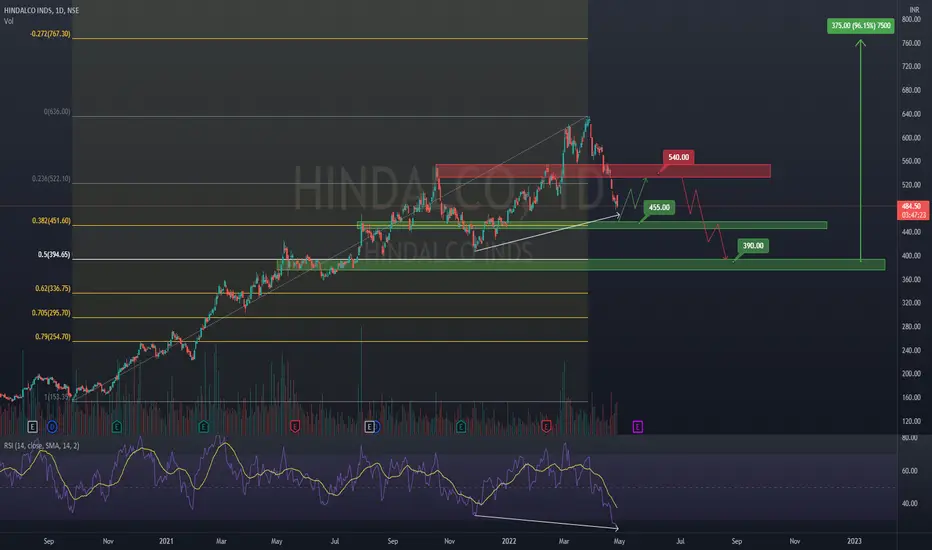
Chart shows clear downtrend in Hindalco.
Strong bullish divergence in RSI on both daily and weekly timeframe hinting towards possible retracement.
Expecting key support around 455 level for a retracement till 540 level.
After which it will head lower towards 390 level to form a zigzag.
That will be the best area to accumulate for long term positional trade.
For short term swing trade:
Buy around 455
Target around 540 (18.5% ROI with 3.6 R:R)
Stop loss @ 430
For long term positional trade:
Buy around 390
Target around 765 (96% ROI with 10.7 R:R)
Stop loss @ 355
Kindly do your own research before trading.
Peace!!
Strong bullish divergence in RSI on both daily and weekly timeframe hinting towards possible retracement.
Expecting key support around 455 level for a retracement till 540 level.
After which it will head lower towards 390 level to form a zigzag.
That will be the best area to accumulate for long term positional trade.
For short term swing trade:
Buy around 455
Target around 540 (18.5% ROI with 3.6 R:R)
Stop loss @ 430
For long term positional trade:
Buy around 390
Target around 765 (96% ROI with 10.7 R:R)
Stop loss @ 355
Kindly do your own research before trading.
Peace!!

คำจำกัดสิทธิ์ความรับผิดชอบ
ข้อมูลและบทความไม่ได้มีวัตถุประสงค์เพื่อก่อให้เกิดกิจกรรมทางการเงิน, การลงทุน, การซื้อขาย, ข้อเสนอแนะ หรือคำแนะนำประเภทอื่น ๆ ที่ให้หรือรับรองโดย TradingView อ่านเพิ่มเติมใน ข้อกำหนดการใช้งาน
คำจำกัดสิทธิ์ความรับผิดชอบ
ข้อมูลและบทความไม่ได้มีวัตถุประสงค์เพื่อก่อให้เกิดกิจกรรมทางการเงิน, การลงทุน, การซื้อขาย, ข้อเสนอแนะ หรือคำแนะนำประเภทอื่น ๆ ที่ให้หรือรับรองโดย TradingView อ่านเพิ่มเติมใน ข้อกำหนดการใช้งาน