
📍 Current Price Snapshot (latest close / recent trade)
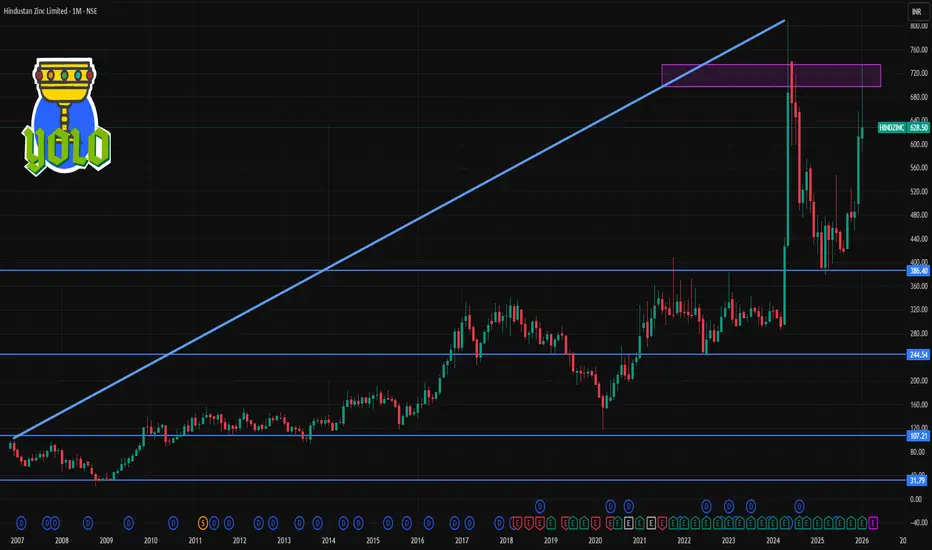
HINDZINC is trading around ~₹628–₹630 on NSE/BSE — after some volatility in recent sessions. Its 52‑week high is ~₹733 and 52‑week low ~₹378.15, showing wide longer‑term movement.
🛠 1‑Month Technical Levels (Support & Resistance)
These are the key zones traders watch for a 1‑month period based on pivot analysis and recent price action:
🔼 Resistance Levels (Upside Targets)
1. ₹705 – ₹715: Immediate resistance zone around recent highs and pivot R1/R2 cluster.
2. ₹735 – ₹750: Next major supply/resistance area — crossing this would signal stronger upside continuation.
3. ₹760 – ₹780+: Extended breakout zone if sentiment turns sharply bullish (higher targets from pivot extensions).
📌 Overall, ₹705–₹715 is the near‑term hurdle the stock needs to clear for a bullish run.
🔽 Support Levels (Downside Price Floors)
1. ₹690 – ₹700: First strong support near recent consolidation lows/pivot S1.
2. ₹670 – ₹680: Secondary support — a deeper pullback zone.
3. ₹650 – ₹660: Key base area — breakdown below this can signal more downside pressure.
4. ₹620 – ₹630: Major structural support if broad market or metals weakness intensifies.
📌 The ₹670–₹700 band acts as the core support area this month.
⚠️ Quick Summary
✔ Above ₹705–₹715 = bullish continuation likely.
✔ Between ₹670–₹700 = consolidation zone.
✔ Below ₹650 = risk of deeper retracement.
HINDZINC is trading around ~₹628–₹630 on NSE/BSE — after some volatility in recent sessions. Its 52‑week high is ~₹733 and 52‑week low ~₹378.15, showing wide longer‑term movement.
🛠 1‑Month Technical Levels (Support & Resistance)
These are the key zones traders watch for a 1‑month period based on pivot analysis and recent price action:
🔼 Resistance Levels (Upside Targets)
1. ₹705 – ₹715: Immediate resistance zone around recent highs and pivot R1/R2 cluster.
2. ₹735 – ₹750: Next major supply/resistance area — crossing this would signal stronger upside continuation.
3. ₹760 – ₹780+: Extended breakout zone if sentiment turns sharply bullish (higher targets from pivot extensions).
📌 Overall, ₹705–₹715 is the near‑term hurdle the stock needs to clear for a bullish run.
🔽 Support Levels (Downside Price Floors)
1. ₹690 – ₹700: First strong support near recent consolidation lows/pivot S1.
2. ₹670 – ₹680: Secondary support — a deeper pullback zone.
3. ₹650 – ₹660: Key base area — breakdown below this can signal more downside pressure.
4. ₹620 – ₹630: Major structural support if broad market or metals weakness intensifies.
📌 The ₹670–₹700 band acts as the core support area this month.
⚠️ Quick Summary
✔ Above ₹705–₹715 = bullish continuation likely.
✔ Between ₹670–₹700 = consolidation zone.
✔ Below ₹650 = risk of deeper retracement.

Contact Knowledgehub for a detailed consultation: Dm on WhatsApp: [wa.link/a2o0kz]-
Phone No: [+91 93102 26243]-
Email: [tradingviewknowledgehub@gmail.com]---
-- Let’s achieve success together!
Phone No: [+91 93102 26243]-
Email: [tradingviewknowledgehub@gmail.com]---
-- Let’s achieve success together!
การนำเสนอที่เกี่ยวข้อง
คำจำกัดสิทธิ์ความรับผิดชอบ
ข้อมูลและบทความไม่ได้มีวัตถุประสงค์เพื่อก่อให้เกิดกิจกรรมทางการเงิน, การลงทุน, การซื้อขาย, ข้อเสนอแนะ หรือคำแนะนำประเภทอื่น ๆ ที่ให้หรือรับรองโดย TradingView อ่านเพิ่มเติมใน ข้อกำหนดการใช้งาน
Contact Knowledgehub for a detailed consultation: Dm on WhatsApp: [wa.link/a2o0kz]-
Phone No: [+91 93102 26243]-
Email: [tradingviewknowledgehub@gmail.com]---
-- Let’s achieve success together!
Phone No: [+91 93102 26243]-
Email: [tradingviewknowledgehub@gmail.com]---
-- Let’s achieve success together!
การนำเสนอที่เกี่ยวข้อง
คำจำกัดสิทธิ์ความรับผิดชอบ
ข้อมูลและบทความไม่ได้มีวัตถุประสงค์เพื่อก่อให้เกิดกิจกรรมทางการเงิน, การลงทุน, การซื้อขาย, ข้อเสนอแนะ หรือคำแนะนำประเภทอื่น ๆ ที่ให้หรือรับรองโดย TradingView อ่านเพิ่มเติมใน ข้อกำหนดการใช้งาน