
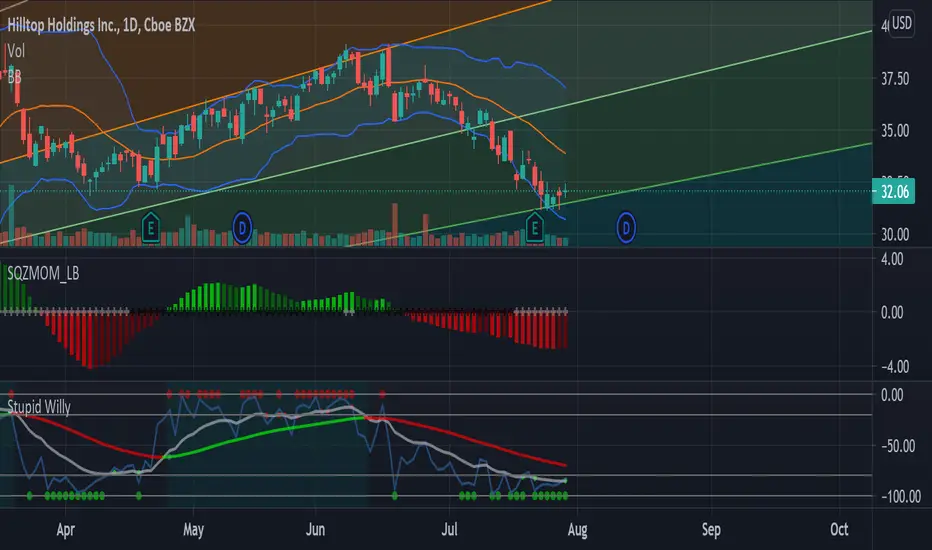
I wanted to see how HTH reacted when faced with its Fibonacci Support and from the looks of it, it showed it has room for bullishness. The squeeze indicator indicated a decline in selling momentum with an additional oversold indication given by the Oscillator. I would swing this stock all the way up to 35-37.
Bullish Signals
-Fibonacci Support Bounce
-Oversold via oscillator
-Squeeze
Price Targets
-1st 35
-2nd 37
Bullish Signals
-Fibonacci Support Bounce
-Oversold via oscillator
-Squeeze
Price Targets
-1st 35
-2nd 37

คำจำกัดสิทธิ์ความรับผิดชอบ
ข้อมูลและบทความไม่ได้มีวัตถุประสงค์เพื่อก่อให้เกิดกิจกรรมทางการเงิน, การลงทุน, การซื้อขาย, ข้อเสนอแนะ หรือคำแนะนำประเภทอื่น ๆ ที่ให้หรือรับรองโดย TradingView อ่านเพิ่มเติมใน ข้อกำหนดการใช้งาน
คำจำกัดสิทธิ์ความรับผิดชอบ
ข้อมูลและบทความไม่ได้มีวัตถุประสงค์เพื่อก่อให้เกิดกิจกรรมทางการเงิน, การลงทุน, การซื้อขาย, ข้อเสนอแนะ หรือคำแนะนำประเภทอื่น ๆ ที่ให้หรือรับรองโดย TradingView อ่านเพิ่มเติมใน ข้อกำหนดการใช้งาน