
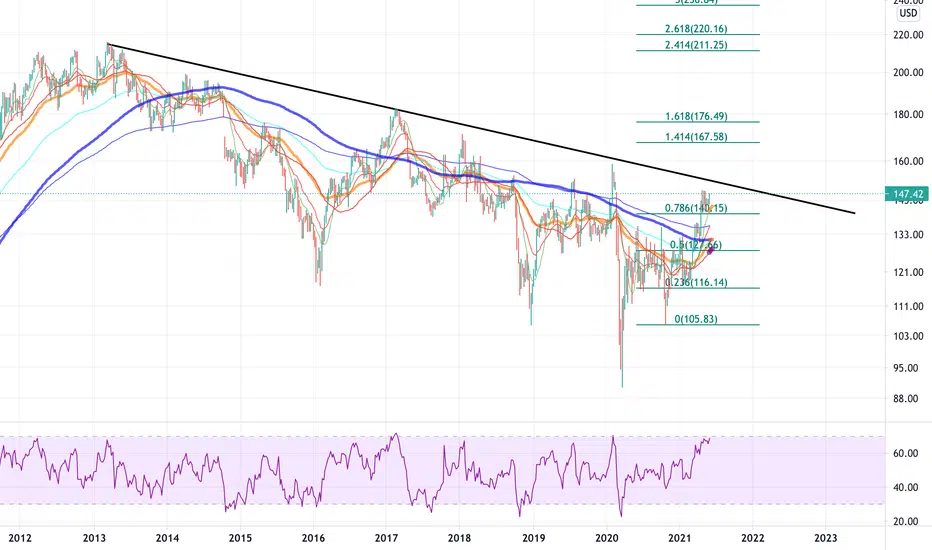
IBM weekly chart is currently in a downtrend but bullish cross of moving averages and potential break of the trend line could signify a change of trend and a profitable long trade.
I would wait for for the price to break the trend line (black line on the chart) to enter a long swing trade with a stop loss not too far to protect from a failed break.
Levels and targets on the chart.
Trade safe.
I would wait for for the price to break the trend line (black line on the chart) to enter a long swing trade with a stop loss not too far to protect from a failed break.
Levels and targets on the chart.
Trade safe.

คำจำกัดสิทธิ์ความรับผิดชอบ
ข้อมูลและบทความไม่ได้มีวัตถุประสงค์เพื่อก่อให้เกิดกิจกรรมทางการเงิน, การลงทุน, การซื้อขาย, ข้อเสนอแนะ หรือคำแนะนำประเภทอื่น ๆ ที่ให้หรือรับรองโดย TradingView อ่านเพิ่มเติมใน ข้อกำหนดการใช้งาน
คำจำกัดสิทธิ์ความรับผิดชอบ
ข้อมูลและบทความไม่ได้มีวัตถุประสงค์เพื่อก่อให้เกิดกิจกรรมทางการเงิน, การลงทุน, การซื้อขาย, ข้อเสนอแนะ หรือคำแนะนำประเภทอื่น ๆ ที่ให้หรือรับรองโดย TradingView อ่านเพิ่มเติมใน ข้อกำหนดการใช้งาน