
Topic Statement:
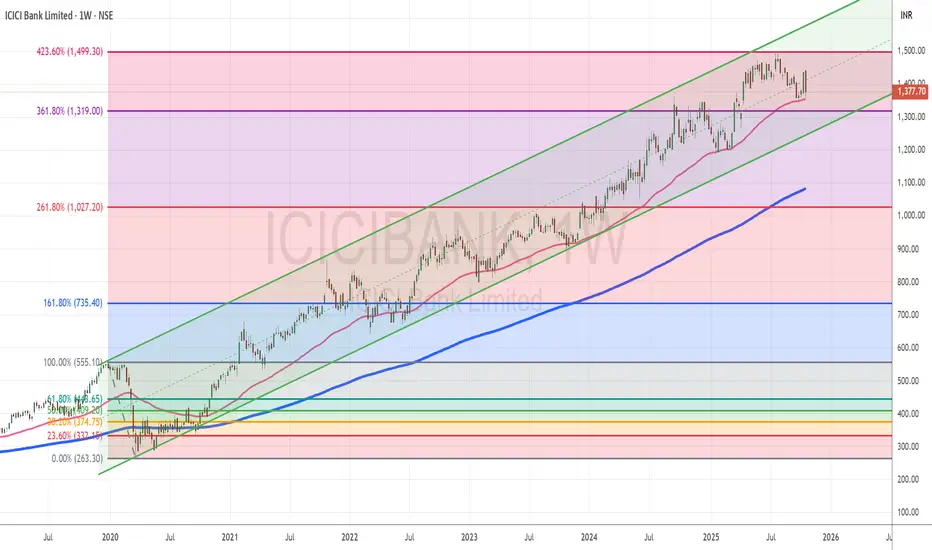
ICICI Bank continues its long-term bull run, supported consistently by technical levels, but now approaches a key resistance near the 1500 mark.
Key Points:
1. The stock trades reliably within a well-defined up-trending channel, maintaining long-term bullish structure
2. Price is repeatedly supported by the 50-day EMA, acting as a dynamic floor throughout its rallies
3. It has only dipped below the 200-day EMA during rare deep corrections, like the COVID crash of 2020
4. Based on the Fibonacci levels plotted from the 2020 correction, the 423.6% extension lies near 1500 — a level already reached, where the stock may now face stiff resistance
ICICI Bank continues its long-term bull run, supported consistently by technical levels, but now approaches a key resistance near the 1500 mark.
Key Points:
1. The stock trades reliably within a well-defined up-trending channel, maintaining long-term bullish structure
2. Price is repeatedly supported by the 50-day EMA, acting as a dynamic floor throughout its rallies
3. It has only dipped below the 200-day EMA during rare deep corrections, like the COVID crash of 2020
4. Based on the Fibonacci levels plotted from the 2020 correction, the 423.6% extension lies near 1500 — a level already reached, where the stock may now face stiff resistance

คำจำกัดสิทธิ์ความรับผิดชอบ
ข้อมูลและบทความไม่ได้มีวัตถุประสงค์เพื่อก่อให้เกิดกิจกรรมทางการเงิน, การลงทุน, การซื้อขาย, ข้อเสนอแนะ หรือคำแนะนำประเภทอื่น ๆ ที่ให้หรือรับรองโดย TradingView อ่านเพิ่มเติมใน ข้อกำหนดการใช้งาน
คำจำกัดสิทธิ์ความรับผิดชอบ
ข้อมูลและบทความไม่ได้มีวัตถุประสงค์เพื่อก่อให้เกิดกิจกรรมทางการเงิน, การลงทุน, การซื้อขาย, ข้อเสนอแนะ หรือคำแนะนำประเภทอื่น ๆ ที่ให้หรือรับรองโดย TradingView อ่านเพิ่มเติมใน ข้อกำหนดการใช้งาน