
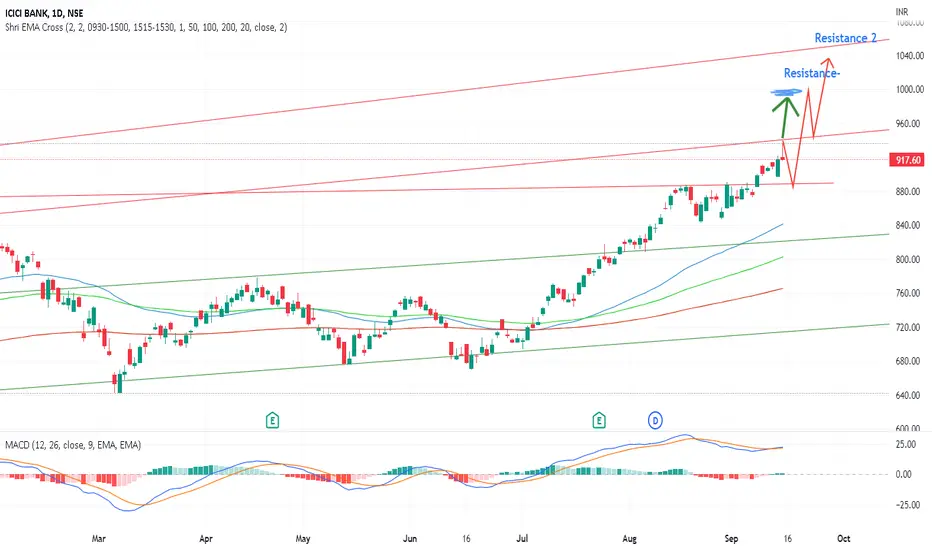
ICICIBANK - in daily chart macd line is above macd signal line and rsi not in overbought zone and 3 ema in cross above eachothers......
1. First resistance is 1000
2. Resistance is long trendline as per weekly chart
3. RSI not in overbought zone in - MONTHLY CHART
4. RSI not in overbought zone in - WEEKLY CHART
5. MACD line crossed above in monthly weekly chart
If you found helpful please like
Thank You0
1. First resistance is 1000
2. Resistance is long trendline as per weekly chart
3. RSI not in overbought zone in - MONTHLY CHART
4. RSI not in overbought zone in - WEEKLY CHART
5. MACD line crossed above in monthly weekly chart
If you found helpful please like
Thank You0

คำจำกัดสิทธิ์ความรับผิดชอบ
ข้อมูลและบทความไม่ได้มีวัตถุประสงค์เพื่อก่อให้เกิดกิจกรรมทางการเงิน, การลงทุน, การซื้อขาย, ข้อเสนอแนะ หรือคำแนะนำประเภทอื่น ๆ ที่ให้หรือรับรองโดย TradingView อ่านเพิ่มเติมใน ข้อกำหนดการใช้งาน
คำจำกัดสิทธิ์ความรับผิดชอบ
ข้อมูลและบทความไม่ได้มีวัตถุประสงค์เพื่อก่อให้เกิดกิจกรรมทางการเงิน, การลงทุน, การซื้อขาย, ข้อเสนอแนะ หรือคำแนะนำประเภทอื่น ๆ ที่ให้หรือรับรองโดย TradingView อ่านเพิ่มเติมใน ข้อกำหนดการใช้งาน