
Hi All,
Observations:
==========================================================
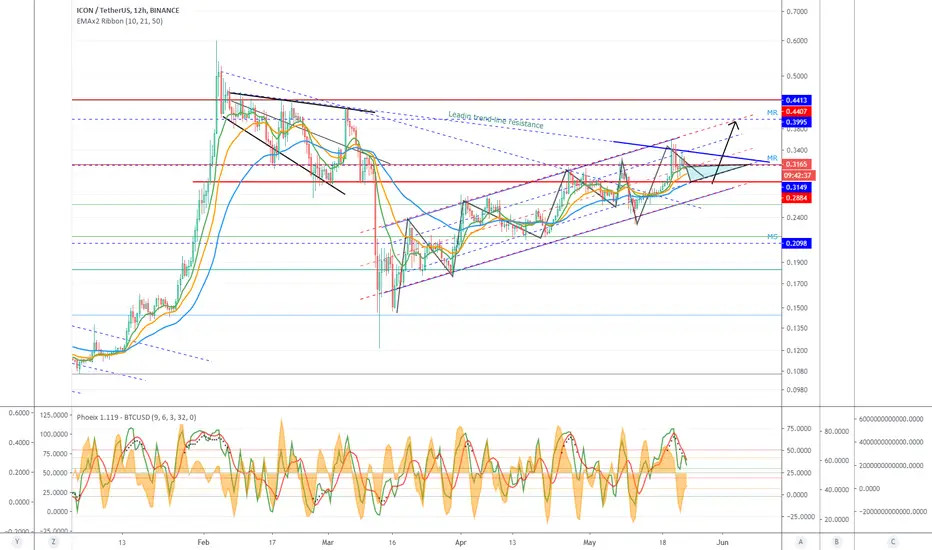
> ICON \ ICX shows a nice price action within a channel in a uptrend with higher highs and higher lows
> 1st rejection with the lead in trend line (resistance)
> The 10\20 and 50 ema have shown levels of support
> Bearish divergence has played out on the 12H as per this chart
> MR and MS are monthly resistance and support lines
Thoughts:
==========================================================
> BTC dominance is dropping
> 12 Hourly chart indicator shows downward pressure still their based on the RSI, also there on the daily chart
> Looking for confluence of price reversal at these moving average levels or fib levels in the channel
> So with this context, we can use the 10, 21, or 50 ema and or the levels in the channel, to look for setups for entry (in the 6 H, 12 H time frame, as per chart)
> Triangle area is my area of interest to enter (0.28 to 0.31)
Close up view > Area of interest 0.28 to 0.31

6 HRLY chart > downward pressure still there with bearish divergence in play

12 HRLY chart > downward pressure still there with bearish divergence in play

1 Day and above chart > MACD has bullish tone

Holistic overview > observe how the trend line is playing resistance and the 1st rejection.

Observations:
==========================================================
> ICON \ ICX shows a nice price action within a channel in a uptrend with higher highs and higher lows
> 1st rejection with the lead in trend line (resistance)
> The 10\20 and 50 ema have shown levels of support
> Bearish divergence has played out on the 12H as per this chart
> MR and MS are monthly resistance and support lines
Thoughts:
==========================================================
> BTC dominance is dropping
> 12 Hourly chart indicator shows downward pressure still their based on the RSI, also there on the daily chart
> Looking for confluence of price reversal at these moving average levels or fib levels in the channel
> So with this context, we can use the 10, 21, or 50 ema and or the levels in the channel, to look for setups for entry (in the 6 H, 12 H time frame, as per chart)
> Triangle area is my area of interest to enter (0.28 to 0.31)
Close up view > Area of interest 0.28 to 0.31
6 HRLY chart > downward pressure still there with bearish divergence in play
12 HRLY chart > downward pressure still there with bearish divergence in play
1 Day and above chart > MACD has bullish tone
Holistic overview > observe how the trend line is playing resistance and the 1st rejection.
บันทึก
บันทึก
That spike was short lived and I see more downward pressure on the 12 HRLY and below.บันทึก
That level makes senseบันทึก
บันทึก
Reference: F.3-4.Chartบันทึก
บันทึก

Discord: discord.com/invite/vb4hbP88vb (TradeToProspa)
Telegram: t.me/TprospaTradersbot
This community has signals now but with no risk management comms.
Telegram: t.me/TprospaTradersbot
This community has signals now but with no risk management comms.
คำจำกัดสิทธิ์ความรับผิดชอบ
ข้อมูลและบทความไม่ได้มีวัตถุประสงค์เพื่อก่อให้เกิดกิจกรรมทางการเงิน, การลงทุน, การซื้อขาย, ข้อเสนอแนะ หรือคำแนะนำประเภทอื่น ๆ ที่ให้หรือรับรองโดย TradingView อ่านเพิ่มเติมใน ข้อกำหนดการใช้งาน
Discord: discord.com/invite/vb4hbP88vb (TradeToProspa)
Telegram: t.me/TprospaTradersbot
This community has signals now but with no risk management comms.
Telegram: t.me/TprospaTradersbot
This community has signals now but with no risk management comms.
คำจำกัดสิทธิ์ความรับผิดชอบ
ข้อมูลและบทความไม่ได้มีวัตถุประสงค์เพื่อก่อให้เกิดกิจกรรมทางการเงิน, การลงทุน, การซื้อขาย, ข้อเสนอแนะ หรือคำแนะนำประเภทอื่น ๆ ที่ให้หรือรับรองโดย TradingView อ่านเพิ่มเติมใน ข้อกำหนดการใช้งาน