
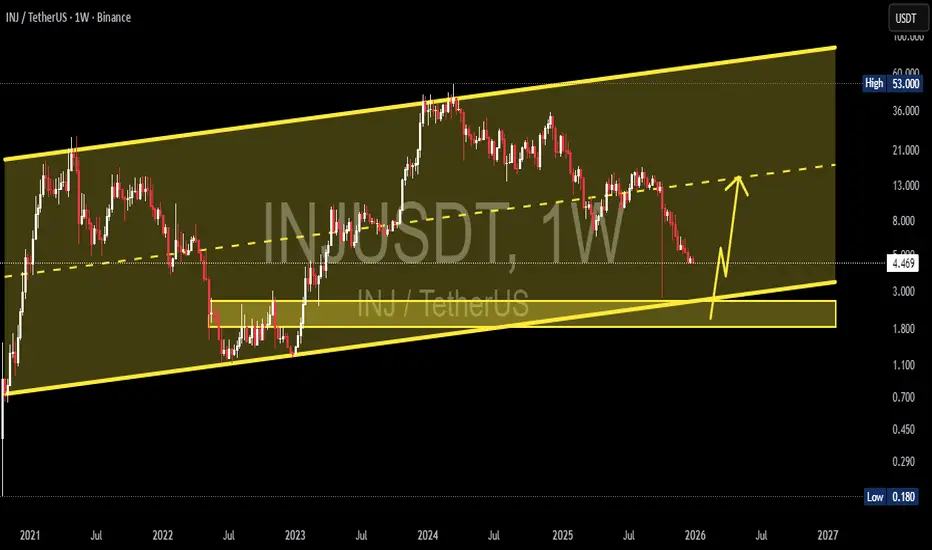
INJ/USDT on the Weekly (1W) timeframe is still trading inside a large ascending channel (macro uptrend) that has been in place since 2021. However, price is currently undergoing a deep corrective phase after the previous peak and is approaching a very critical historical demand area.
Price is trading well below the channel midline, indicating medium-term bearish pressure, yet the overall macro structure remains valid as long as the lower channel boundary and the major demand zone hold.
---
Pattern Explanation
1. Ascending Channel (Macro Structure)
Upper boundary: major distribution and repeated rejections (previous ATH area).
Channel midline: equilibrium zone.
Lower boundary: long-term accumulation area.
Price is now moving toward the lower boundary, which historically acts as a strong bullish reaction zone.
2. Weekly Distribution → Breakdown
A clear distribution range formed near the top (around 40–50 USDT).
Breakdown from this range created lower highs and lower lows, signaling a medium-term bearish trend.
3. Major Demand Zone (Yellow Block 2.65 – 1.85)
This area represents the base before the previous major bullish impulse.
Confluence with:
Lower boundary of the ascending channel
Historical accumulation zone
Psychological low-price area
This zone acts as the last major support before the macro structure is invalidated.
---
Key Levels
Support
2.65 – 1.85 → Major Weekly Demand Zone (yellow block)
3.80 – 4.20 → Minor support (already broken)
Resistance
6.80 – 7.50 → Breakdown resistance
12.00 – 14.00 → Mid-channel resistance
20.00+ → Major distribution zone
---
Bullish Scenario
Price holds and reacts strongly within the 2.65 – 1.85 demand zone.
Appearance of:
Weekly rejection candles
Bullish engulfing or long lower wicks
Market structure shifts from lower low → higher low.
Bullish Targets
6.80 – 7.50
12.00 – 14.00
20.00+ (if price returns toward mid–upper channel)
Bullish Conclusion:
The 2.65 – 1.85 zone may act as a long-term accumulation area if buyers successfully defend the lower channel.
---
Bearish Scenario
A confirmed weekly close below 1.85.
Breakdown of the ascending channel lower boundary.
Macro structure shifts from uptrend to downtrend.
Bearish Implications
Potential extended capitulation phase
Price may enter:
A prolonged sideways range
Or search for a new demand zone below the current structure
Bearish Conclusion:
Losing the 1.85 level would signal macro structural failure, significantly increasing downside risk.
---
Conclusion
INJ/USDT is currently at a macro decision zone.
The 2.65 – 1.85 demand area is not just a regular support—it is the foundation of the long-term bullish structure.
Strong reaction = potential major reversal
Breakdown = macro trend shift
Waiting for weekly price action confirmation is strongly recommended.
---
#INJ #INJUSDT #CryptoAnalysis #WeeklyChart #AscendingChannel #DemandZone #SupportResistance #PriceAction #MarketStructure #AltcoinAnalysis
Price is trading well below the channel midline, indicating medium-term bearish pressure, yet the overall macro structure remains valid as long as the lower channel boundary and the major demand zone hold.
---
Pattern Explanation
1. Ascending Channel (Macro Structure)
Upper boundary: major distribution and repeated rejections (previous ATH area).
Channel midline: equilibrium zone.
Lower boundary: long-term accumulation area.
Price is now moving toward the lower boundary, which historically acts as a strong bullish reaction zone.
2. Weekly Distribution → Breakdown
A clear distribution range formed near the top (around 40–50 USDT).
Breakdown from this range created lower highs and lower lows, signaling a medium-term bearish trend.
3. Major Demand Zone (Yellow Block 2.65 – 1.85)
This area represents the base before the previous major bullish impulse.
Confluence with:
Lower boundary of the ascending channel
Historical accumulation zone
Psychological low-price area
This zone acts as the last major support before the macro structure is invalidated.
---
Key Levels
Support
2.65 – 1.85 → Major Weekly Demand Zone (yellow block)
3.80 – 4.20 → Minor support (already broken)
Resistance
6.80 – 7.50 → Breakdown resistance
12.00 – 14.00 → Mid-channel resistance
20.00+ → Major distribution zone
---
Bullish Scenario
Price holds and reacts strongly within the 2.65 – 1.85 demand zone.
Appearance of:
Weekly rejection candles
Bullish engulfing or long lower wicks
Market structure shifts from lower low → higher low.
Bullish Targets
6.80 – 7.50
12.00 – 14.00
20.00+ (if price returns toward mid–upper channel)
Bullish Conclusion:
The 2.65 – 1.85 zone may act as a long-term accumulation area if buyers successfully defend the lower channel.
---
Bearish Scenario
A confirmed weekly close below 1.85.
Breakdown of the ascending channel lower boundary.
Macro structure shifts from uptrend to downtrend.
Bearish Implications
Potential extended capitulation phase
Price may enter:
A prolonged sideways range
Or search for a new demand zone below the current structure
Bearish Conclusion:
Losing the 1.85 level would signal macro structural failure, significantly increasing downside risk.
---
Conclusion
INJ/USDT is currently at a macro decision zone.
The 2.65 – 1.85 demand area is not just a regular support—it is the foundation of the long-term bullish structure.
Strong reaction = potential major reversal
Breakdown = macro trend shift
Waiting for weekly price action confirmation is strongly recommended.
---
#INJ #INJUSDT #CryptoAnalysis #WeeklyChart #AscendingChannel #DemandZone #SupportResistance #PriceAction #MarketStructure #AltcoinAnalysis

✅ Get Free Signals! Join Our Telegram Channel Here: t.me/TheCryptoNuclear
✅ Twitter: twitter.com/crypto_nuclear
✅ Join Bybit : partner.bybit.com/b/nuclearvip
✅ Benefits : Lifetime Trading Fee Discount -50%
✅ Twitter: twitter.com/crypto_nuclear
✅ Join Bybit : partner.bybit.com/b/nuclearvip
✅ Benefits : Lifetime Trading Fee Discount -50%
คำจำกัดสิทธิ์ความรับผิดชอบ
ข้อมูลและบทความไม่ได้มีวัตถุประสงค์เพื่อก่อให้เกิดกิจกรรมทางการเงิน, การลงทุน, การซื้อขาย, ข้อเสนอแนะ หรือคำแนะนำประเภทอื่น ๆ ที่ให้หรือรับรองโดย TradingView อ่านเพิ่มเติมใน ข้อกำหนดการใช้งาน
✅ Get Free Signals! Join Our Telegram Channel Here: t.me/TheCryptoNuclear
✅ Twitter: twitter.com/crypto_nuclear
✅ Join Bybit : partner.bybit.com/b/nuclearvip
✅ Benefits : Lifetime Trading Fee Discount -50%
✅ Twitter: twitter.com/crypto_nuclear
✅ Join Bybit : partner.bybit.com/b/nuclearvip
✅ Benefits : Lifetime Trading Fee Discount -50%
คำจำกัดสิทธิ์ความรับผิดชอบ
ข้อมูลและบทความไม่ได้มีวัตถุประสงค์เพื่อก่อให้เกิดกิจกรรมทางการเงิน, การลงทุน, การซื้อขาย, ข้อเสนอแนะ หรือคำแนะนำประเภทอื่น ๆ ที่ให้หรือรับรองโดย TradingView อ่านเพิ่มเติมใน ข้อกำหนดการใช้งาน