
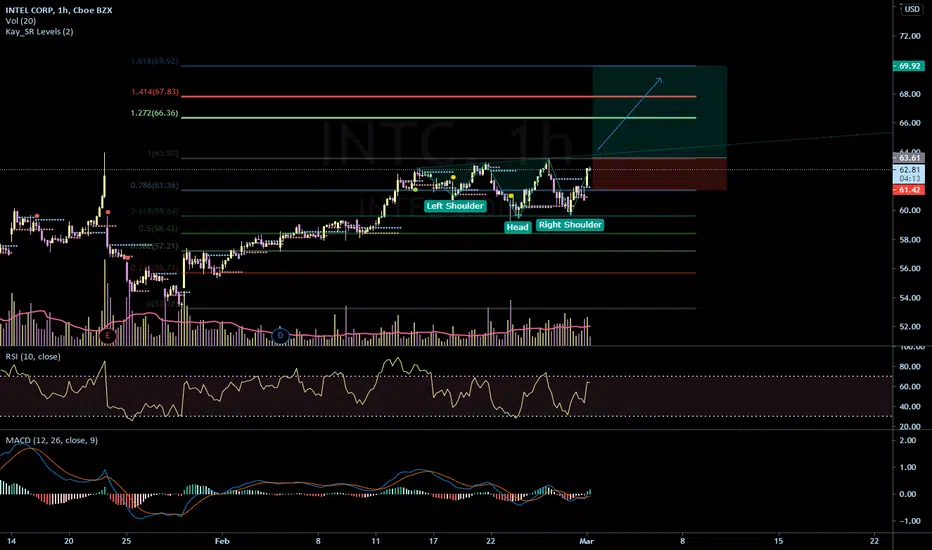
On the 1h chart INTC can be seen forming an inverse Head and Shoulders Pattern, or even a Double Bottom pattern. This is a very bullish sign, with the MACD transitioning into the green. If Intel successfully breaks the 63.57 line, it could go long having price targets of:
$66.30 - $67.80 - $70.00
In my opinion this looks like a very safe bull play on INTC. Always remember to buy the dip, thanks for viewing!
$66.30 - $67.80 - $70.00
In my opinion this looks like a very safe bull play on INTC. Always remember to buy the dip, thanks for viewing!

คำจำกัดสิทธิ์ความรับผิดชอบ
ข้อมูลและบทความไม่ได้มีวัตถุประสงค์เพื่อก่อให้เกิดกิจกรรมทางการเงิน, การลงทุน, การซื้อขาย, ข้อเสนอแนะ หรือคำแนะนำประเภทอื่น ๆ ที่ให้หรือรับรองโดย TradingView อ่านเพิ่มเติมใน ข้อกำหนดการใช้งาน
คำจำกัดสิทธิ์ความรับผิดชอบ
ข้อมูลและบทความไม่ได้มีวัตถุประสงค์เพื่อก่อให้เกิดกิจกรรมทางการเงิน, การลงทุน, การซื้อขาย, ข้อเสนอแนะ หรือคำแนะนำประเภทอื่น ๆ ที่ให้หรือรับรองโดย TradingView อ่านเพิ่มเติมใน ข้อกำหนดการใช้งาน