
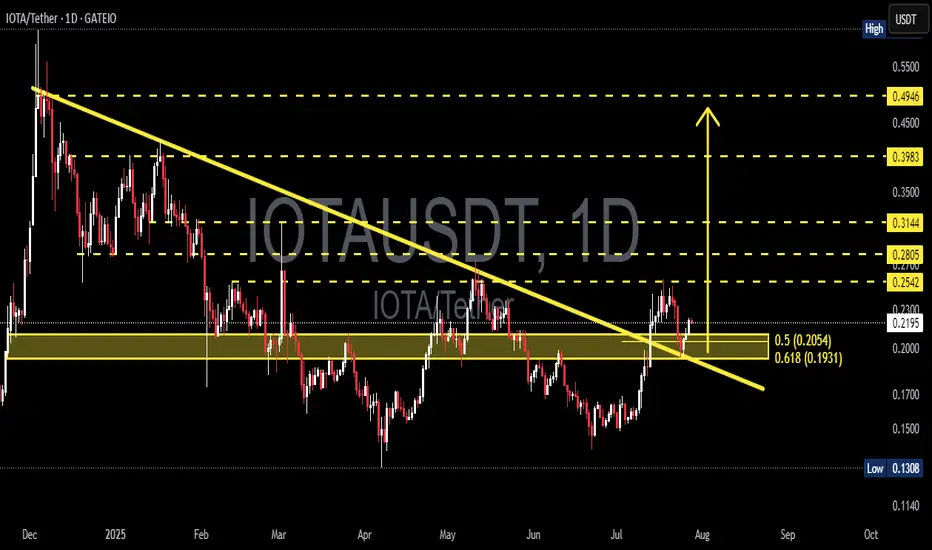
📊 Chart Overview
After spending several months under pressure within a long-term descending trendline since December 2024, IOTA has finally shown a highly promising technical signal. The recent breakout didn’t just pierce the trendline — it was confirmed by a successful retest of the golden Fibonacci zone, a classic reversal trigger in technical analysis.
> This is a classic early sign of a potential trend reversal, often followed by strong momentum plays.
---
🧠 Structure & Pattern: Signs of a Macro Reversal
✅ Descending Trendline Breakout
Price has broken through a major downtrend line that had held for over 7 months, signaling a shift in market dynamics from sellers to buyers.
✅ Fibonacci Golden Pocket Retest (0.5–0.618)
The pullback landed perfectly at the golden pocket (0.2054–0.1931), a highly watched confluence area for reversals. Price bounced right from this support, showing buy-side strength.
✅ Demand Zone Activation
The yellow box highlights a previous accumulation zone that now acts as strong demand, reinforcing the potential for an upward continuation.
---
🟢 Bullish Scenario (Structured Upside Potential)
If the price holds above 0.2054:
Short-Term Targets:
📈 0.2542 → Minor resistance & previous breakout area
📈 0.2805 → Key psychological zone and past rejection area
Mid–Long-Term Targets:
💰 0.3144 → Historical resistance
💰 0.3983 → Fibonacci extension zone
💰 0.4946 → Final major resistance before the previous macro downtrend
Confirmation:
A daily candle close above 0.2542 with increasing volume would strongly validate the bullish continuation.
---
🔴 Bearish Scenario (Potential Fakeout Risk)
If the price fails to hold above the 0.1931 zone:
⚠️ It may turn into a fake breakout, indicating that buyers weren’t strong enough to sustain the breakout.
Downside targets to watch:
🧱 0.1700 → Minor psychological support
🧱 0.1308 → Previous macro low and critical support
---
🎯 Conclusion & Trading Strategy
IOTA is currently at a critical decision point, balancing between a confirmed macro reversal and a possible fakeout. However, the technical breakout above a long-standing trendline — combined with a retest of the golden pocket zone — puts bulls in a favorable position for a potential rally.
🔍 What to watch next:
Price action above 0.2200–0.2540
Volume confirmation on breakout levels
This setup is ideal for early trend traders, swing traders, or position traders looking to ride a larger bullish wave with well-defined risk.
#IOTAUSDT #CryptoBreakout #MacroReversal #FibonacciSupport #BullishSetup #AltcoinAnalysis #CryptoTechnicalAnalysis #TrendlineBreak #BuyTheDip
After spending several months under pressure within a long-term descending trendline since December 2024, IOTA has finally shown a highly promising technical signal. The recent breakout didn’t just pierce the trendline — it was confirmed by a successful retest of the golden Fibonacci zone, a classic reversal trigger in technical analysis.
> This is a classic early sign of a potential trend reversal, often followed by strong momentum plays.
---
🧠 Structure & Pattern: Signs of a Macro Reversal
✅ Descending Trendline Breakout
Price has broken through a major downtrend line that had held for over 7 months, signaling a shift in market dynamics from sellers to buyers.
✅ Fibonacci Golden Pocket Retest (0.5–0.618)
The pullback landed perfectly at the golden pocket (0.2054–0.1931), a highly watched confluence area for reversals. Price bounced right from this support, showing buy-side strength.
✅ Demand Zone Activation
The yellow box highlights a previous accumulation zone that now acts as strong demand, reinforcing the potential for an upward continuation.
---
🟢 Bullish Scenario (Structured Upside Potential)
If the price holds above 0.2054:
Short-Term Targets:
📈 0.2542 → Minor resistance & previous breakout area
📈 0.2805 → Key psychological zone and past rejection area
Mid–Long-Term Targets:
💰 0.3144 → Historical resistance
💰 0.3983 → Fibonacci extension zone
💰 0.4946 → Final major resistance before the previous macro downtrend
Confirmation:
A daily candle close above 0.2542 with increasing volume would strongly validate the bullish continuation.
---
🔴 Bearish Scenario (Potential Fakeout Risk)
If the price fails to hold above the 0.1931 zone:
⚠️ It may turn into a fake breakout, indicating that buyers weren’t strong enough to sustain the breakout.
Downside targets to watch:
🧱 0.1700 → Minor psychological support
🧱 0.1308 → Previous macro low and critical support
---
🎯 Conclusion & Trading Strategy
IOTA is currently at a critical decision point, balancing between a confirmed macro reversal and a possible fakeout. However, the technical breakout above a long-standing trendline — combined with a retest of the golden pocket zone — puts bulls in a favorable position for a potential rally.
🔍 What to watch next:
Price action above 0.2200–0.2540
Volume confirmation on breakout levels
This setup is ideal for early trend traders, swing traders, or position traders looking to ride a larger bullish wave with well-defined risk.
#IOTAUSDT #CryptoBreakout #MacroReversal #FibonacciSupport #BullishSetup #AltcoinAnalysis #CryptoTechnicalAnalysis #TrendlineBreak #BuyTheDip

✅ Get Free Signals! Join Our Telegram Channel Here: t.me/TheCryptoNuclear
✅ Twitter: twitter.com/crypto_nuclear
✅ Join Bybit : partner.bybit.com/b/nuclearvip
✅ Benefits : Lifetime Trading Fee Discount -50%
✅ Twitter: twitter.com/crypto_nuclear
✅ Join Bybit : partner.bybit.com/b/nuclearvip
✅ Benefits : Lifetime Trading Fee Discount -50%
คำจำกัดสิทธิ์ความรับผิดชอบ
ข้อมูลและบทความไม่ได้มีวัตถุประสงค์เพื่อก่อให้เกิดกิจกรรมทางการเงิน, การลงทุน, การซื้อขาย, ข้อเสนอแนะ หรือคำแนะนำประเภทอื่น ๆ ที่ให้หรือรับรองโดย TradingView อ่านเพิ่มเติมใน ข้อกำหนดการใช้งาน
✅ Get Free Signals! Join Our Telegram Channel Here: t.me/TheCryptoNuclear
✅ Twitter: twitter.com/crypto_nuclear
✅ Join Bybit : partner.bybit.com/b/nuclearvip
✅ Benefits : Lifetime Trading Fee Discount -50%
✅ Twitter: twitter.com/crypto_nuclear
✅ Join Bybit : partner.bybit.com/b/nuclearvip
✅ Benefits : Lifetime Trading Fee Discount -50%
คำจำกัดสิทธิ์ความรับผิดชอบ
ข้อมูลและบทความไม่ได้มีวัตถุประสงค์เพื่อก่อให้เกิดกิจกรรมทางการเงิน, การลงทุน, การซื้อขาย, ข้อเสนอแนะ หรือคำแนะนำประเภทอื่น ๆ ที่ให้หรือรับรองโดย TradingView อ่านเพิ่มเติมใน ข้อกำหนดการใช้งาน