
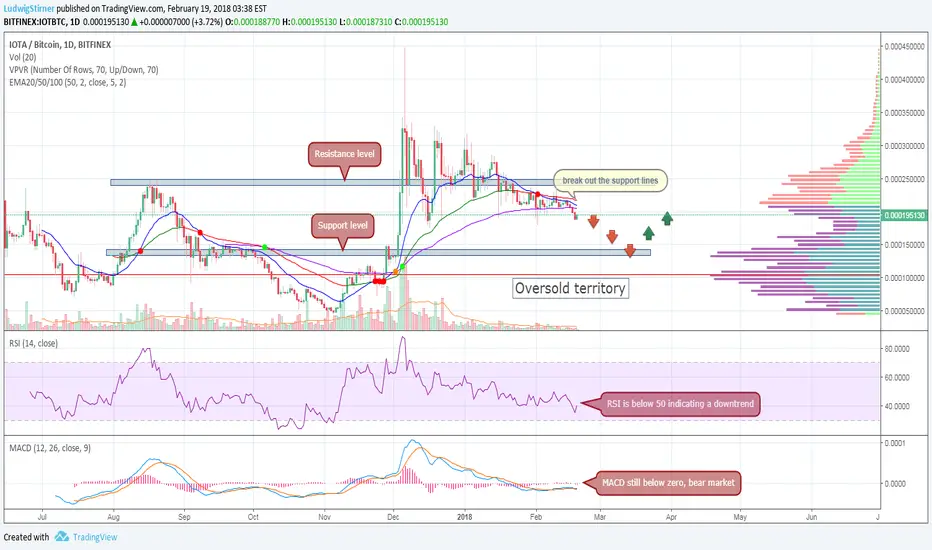
IOTA price faces stiff resistance from its 20-day EMA. The 20-day EMA has been a strong support to the coin over the last 3 months. However, the price fell below the 20-day EMA in the starting of mid-January and since then has not been able to break above it. The coin price came very close to its 20-day EMA on February 1st but was not able to break out. In the last 3 months, IOTA price has always bounced back after testing the 20-day EMA from above. IOTA is presently trading below all its crucial EMAs, be it the 20-day, 50-day or 100-day EMAs.
This could be in for a prolonged spell of a downtrend. If one takes a look at the technical chart above, it could be observed that the coin is poised for a Death Cross.
"A death cross is a crossover resulting from a security's long-term moving average breaking above its short-term moving average or support level. As long-term indicators carry more weight, this trend indicates a bear market on the horizon and is reinforced by high trading volumes." In IOTA's case, the long-term 100-day EMA is just a few Sats away from going past the short-term 50-day EMA. A Death Cross in the days ahead could further push the IOTA price lower.
RSI is below 50 indicating a downtrend. The MACD turned down at the 9-day moving average, a sell sign.
This could be in for a prolonged spell of a downtrend. If one takes a look at the technical chart above, it could be observed that the coin is poised for a Death Cross.
"A death cross is a crossover resulting from a security's long-term moving average breaking above its short-term moving average or support level. As long-term indicators carry more weight, this trend indicates a bear market on the horizon and is reinforced by high trading volumes." In IOTA's case, the long-term 100-day EMA is just a few Sats away from going past the short-term 50-day EMA. A Death Cross in the days ahead could further push the IOTA price lower.
RSI is below 50 indicating a downtrend. The MACD turned down at the 9-day moving average, a sell sign.

คำจำกัดสิทธิ์ความรับผิดชอบ
ข้อมูลและบทความไม่ได้มีวัตถุประสงค์เพื่อก่อให้เกิดกิจกรรมทางการเงิน, การลงทุน, การซื้อขาย, ข้อเสนอแนะ หรือคำแนะนำประเภทอื่น ๆ ที่ให้หรือรับรองโดย TradingView อ่านเพิ่มเติมใน ข้อกำหนดการใช้งาน
คำจำกัดสิทธิ์ความรับผิดชอบ
ข้อมูลและบทความไม่ได้มีวัตถุประสงค์เพื่อก่อให้เกิดกิจกรรมทางการเงิน, การลงทุน, การซื้อขาย, ข้อเสนอแนะ หรือคำแนะนำประเภทอื่น ๆ ที่ให้หรือรับรองโดย TradingView อ่านเพิ่มเติมใน ข้อกำหนดการใช้งาน