
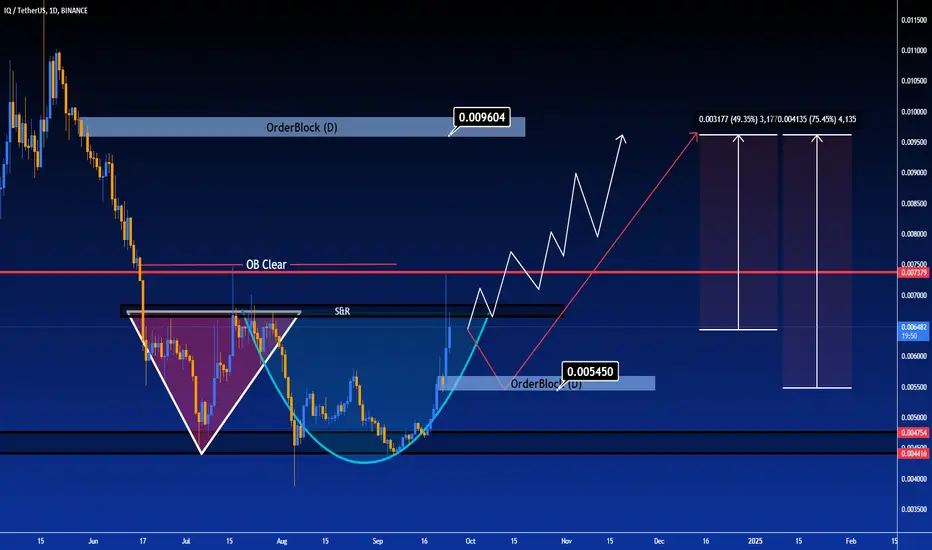
I can see two different senarios for IQ price action.
If the resistence area of this formation breakes by price in this week, price should follow the path that I drew with white arrows.
If the price lost its momentum, it might need to visit daily orderblock down below. In this case I believe the price should follow the Red Arrow I drew on the chart.
Closing below 0,005450 in daily time frame will violate the analysis.
Good luck.
If the resistence area of this formation breakes by price in this week, price should follow the path that I drew with white arrows.
If the price lost its momentum, it might need to visit daily orderblock down below. In this case I believe the price should follow the Red Arrow I drew on the chart.
Closing below 0,005450 in daily time frame will violate the analysis.
Good luck.
บันทึก
IQ has decided to move as the way of second arrow. Now it's in the resistance zone again. Upper this area, we will see the TP will hit.
คำจำกัดสิทธิ์ความรับผิดชอบ
ข้อมูลและบทความไม่ได้มีวัตถุประสงค์เพื่อก่อให้เกิดกิจกรรมทางการเงิน, การลงทุน, การซื้อขาย, ข้อเสนอแนะ หรือคำแนะนำประเภทอื่น ๆ ที่ให้หรือรับรองโดย TradingView อ่านเพิ่มเติมใน ข้อกำหนดการใช้งาน
คำจำกัดสิทธิ์ความรับผิดชอบ
ข้อมูลและบทความไม่ได้มีวัตถุประสงค์เพื่อก่อให้เกิดกิจกรรมทางการเงิน, การลงทุน, การซื้อขาย, ข้อเสนอแนะ หรือคำแนะนำประเภทอื่น ๆ ที่ให้หรือรับรองโดย TradingView อ่านเพิ่มเติมใน ข้อกำหนดการใช้งาน