
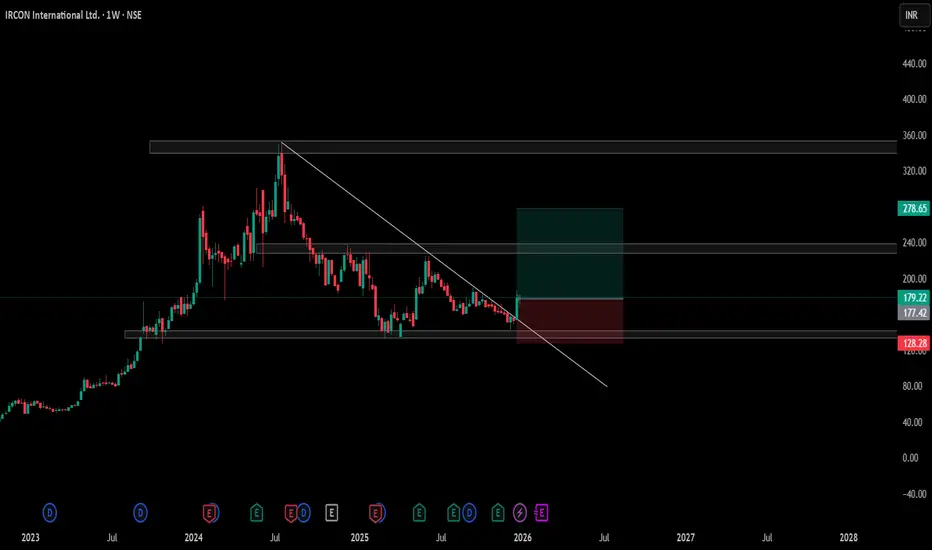
Price has broken above a long-term descending trendline after a prolonged correction phase. The breakout is happening near a strong demand zone around ₹170–175, which has acted as a historical support base. Sustaining above this level indicates a potential trend reversal on the higher timeframe.
The risk–reward structure in the chart looks positive — with downside protection near the support zone and upside room toward the previous supply region around ₹270–280. A weekly closing above the trendline and follow-through buying will strengthen the bullish case. Failure to hold above 170 may weaken the setup.
Key Levels
Entry Zone: ₹175–180
Support / Stop-Loss: ₹128
Potential Upside Zone: ₹270–280
Bias: Bullish above 170 — Trend reversal structure developing.
Disclaimer
This is a technical analysis study for educational purposes only — not investment or trading advice.
The risk–reward structure in the chart looks positive — with downside protection near the support zone and upside room toward the previous supply region around ₹270–280. A weekly closing above the trendline and follow-through buying will strengthen the bullish case. Failure to hold above 170 may weaken the setup.
Key Levels
Entry Zone: ₹175–180
Support / Stop-Loss: ₹128
Potential Upside Zone: ₹270–280
Bias: Bullish above 170 — Trend reversal structure developing.
Disclaimer
This is a technical analysis study for educational purposes only — not investment or trading advice.

คำจำกัดสิทธิ์ความรับผิดชอบ
ข้อมูลและบทความไม่ได้มีวัตถุประสงค์เพื่อก่อให้เกิดกิจกรรมทางการเงิน, การลงทุน, การซื้อขาย, ข้อเสนอแนะ หรือคำแนะนำประเภทอื่น ๆ ที่ให้หรือรับรองโดย TradingView อ่านเพิ่มเติมใน ข้อกำหนดการใช้งาน
คำจำกัดสิทธิ์ความรับผิดชอบ
ข้อมูลและบทความไม่ได้มีวัตถุประสงค์เพื่อก่อให้เกิดกิจกรรมทางการเงิน, การลงทุน, การซื้อขาย, ข้อเสนอแนะ หรือคำแนะนำประเภทอื่น ๆ ที่ให้หรือรับรองโดย TradingView อ่านเพิ่มเติมใน ข้อกำหนดการใช้งาน