
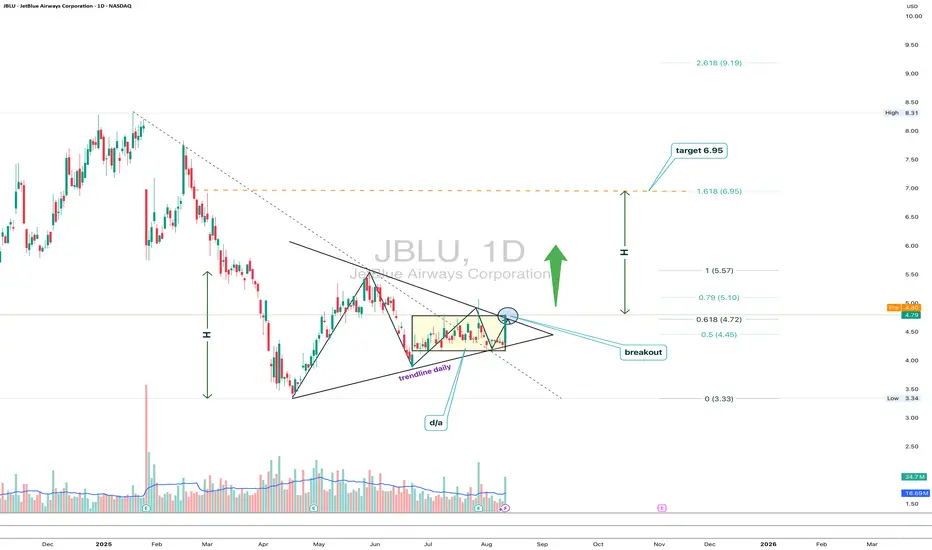
An analysis of JetBlue Airways (JBLU) shares on the daily chart indicates the formation of a bullish pattern with a clear breakout of the resistance level. After consolidation and a rebound from significant support levels, the price broke through the upper boundary of the descending triangle, which is confirmed by an increase in trading volume. This breakout opens the way to a target level around $6.95, which corresponds to the 1.618 Fibonacci extension. Technical analysis indicators also confirm the strengthening of the bullish momentum, pointing to favorable prospects for further growth. We expect the upward movement to continue, with the previous resistance zone acting as a key support level after the breakout. Given the current dynamics and technical signals, JBLU shares are of interest to investors seeking medium-term profits.
การซื้อขายยังคงดำเนินอยู่
#JBLU +17% - trade in progress - target under scenario 6.95 
Наш канал: t.me/totoshkatradingteam
⏺ Брокеры которым доверяю:
FxPro - ib-fxpro.com/?ib=SwHtc7m3
AMarkets - profit-market.info/promo/?g=BZA6ZC
⏺ Брокеры которым доверяю:
FxPro - ib-fxpro.com/?ib=SwHtc7m3
AMarkets - profit-market.info/promo/?g=BZA6ZC
คำจำกัดสิทธิ์ความรับผิดชอบ
ข้อมูลและบทความไม่ได้มีวัตถุประสงค์เพื่อก่อให้เกิดกิจกรรมทางการเงิน, การลงทุน, การซื้อขาย, ข้อเสนอแนะ หรือคำแนะนำประเภทอื่น ๆ ที่ให้หรือรับรองโดย TradingView อ่านเพิ่มเติมใน ข้อกำหนดการใช้งาน
Наш канал: t.me/totoshkatradingteam
⏺ Брокеры которым доверяю:
FxPro - ib-fxpro.com/?ib=SwHtc7m3
AMarkets - profit-market.info/promo/?g=BZA6ZC
⏺ Брокеры которым доверяю:
FxPro - ib-fxpro.com/?ib=SwHtc7m3
AMarkets - profit-market.info/promo/?g=BZA6ZC
คำจำกัดสิทธิ์ความรับผิดชอบ
ข้อมูลและบทความไม่ได้มีวัตถุประสงค์เพื่อก่อให้เกิดกิจกรรมทางการเงิน, การลงทุน, การซื้อขาย, ข้อเสนอแนะ หรือคำแนะนำประเภทอื่น ๆ ที่ให้หรือรับรองโดย TradingView อ่านเพิ่มเติมใน ข้อกำหนดการใช้งาน