
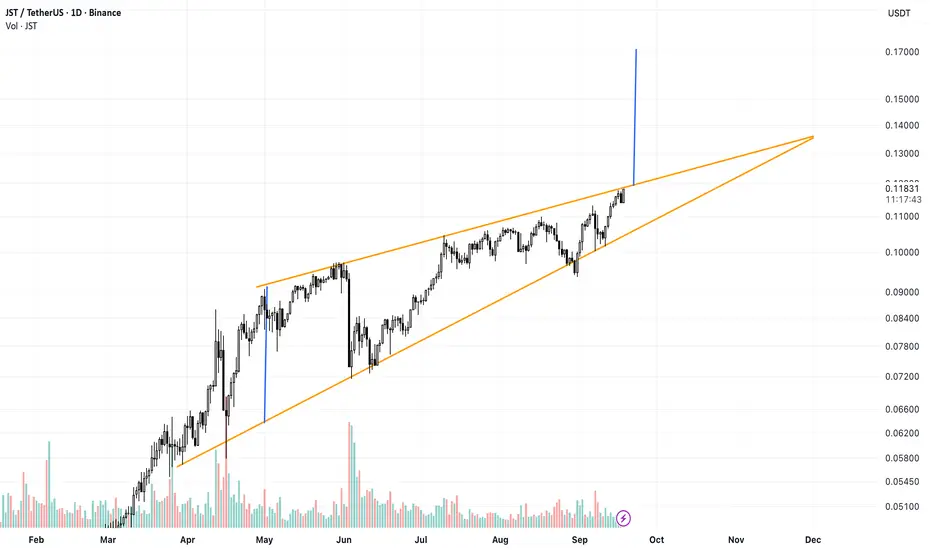
JST/USDT is trading inside a large rising wedge on the 1D chart, with price forming higher highs and higher lows while both trendlines gradually converge. Price is now testing the upper boundary around $0.118–$0.120 after another strong push from the lower support.
A confirmed daily breakout and hold above the upper trendline could trigger a bullish expansion toward the $0.165–$0.170 target area. However, because a rising wedge is traditionally a bearish structure, a rejection from the upper boundary followed by a breakdown below the rising support would weaken the bullish scenario and increase the probability of a deeper correction.
A confirmed daily breakout and hold above the upper trendline could trigger a bullish expansion toward the $0.165–$0.170 target area. However, because a rising wedge is traditionally a bearish structure, a rejection from the upper boundary followed by a breakdown below the rising support would weaken the bullish scenario and increase the probability of a deeper correction.

คำจำกัดสิทธิ์ความรับผิดชอบ
ข้อมูลและบทความไม่ได้มีวัตถุประสงค์เพื่อก่อให้เกิดกิจกรรมทางการเงิน, การลงทุน, การซื้อขาย, ข้อเสนอแนะ หรือคำแนะนำประเภทอื่น ๆ ที่ให้หรือรับรองโดย TradingView อ่านเพิ่มเติมใน ข้อกำหนดการใช้งาน
คำจำกัดสิทธิ์ความรับผิดชอบ
ข้อมูลและบทความไม่ได้มีวัตถุประสงค์เพื่อก่อให้เกิดกิจกรรมทางการเงิน, การลงทุน, การซื้อขาย, ข้อเสนอแนะ หรือคำแนะนำประเภทอื่น ๆ ที่ให้หรือรับรองโดย TradingView อ่านเพิ่มเติมใน ข้อกำหนดการใช้งาน