Long
Trending Kellog
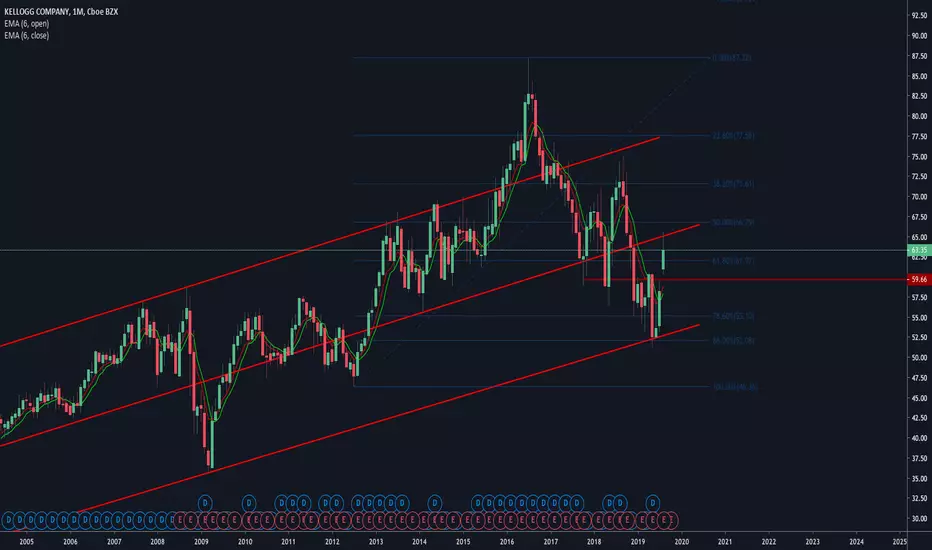
Chart Analysis
It's a bit late, but we see on weekly and monthly chart that $NYSE:K made a nice turn on long term trendline.
Last week the chart formed a nice low around the Fibonacci 78.6.
Of course, we missed the low, but maybe we get a second chance around 60$ to enter.
Dividend
3.6% dividend
Payout ratio 58%
14 years Dividend Growth
It's a bit late, but we see on weekly and monthly chart that $NYSE:K made a nice turn on long term trendline.
Last week the chart formed a nice low around the Fibonacci 78.6.
Of course, we missed the low, but maybe we get a second chance around 60$ to enter.
Dividend
3.6% dividend
Payout ratio 58%
14 years Dividend Growth

คำจำกัดสิทธิ์ความรับผิดชอบ
ข้อมูลและบทความไม่ได้มีวัตถุประสงค์เพื่อก่อให้เกิดกิจกรรมทางการเงิน, การลงทุน, การซื้อขาย, ข้อเสนอแนะ หรือคำแนะนำประเภทอื่น ๆ ที่ให้หรือรับรองโดย TradingView อ่านเพิ่มเติมใน ข้อกำหนดการใช้งาน
คำจำกัดสิทธิ์ความรับผิดชอบ
ข้อมูลและบทความไม่ได้มีวัตถุประสงค์เพื่อก่อให้เกิดกิจกรรมทางการเงิน, การลงทุน, การซื้อขาย, ข้อเสนอแนะ หรือคำแนะนำประเภทอื่น ๆ ที่ให้หรือรับรองโดย TradingView อ่านเพิ่มเติมใน ข้อกำหนดการใช้งาน