
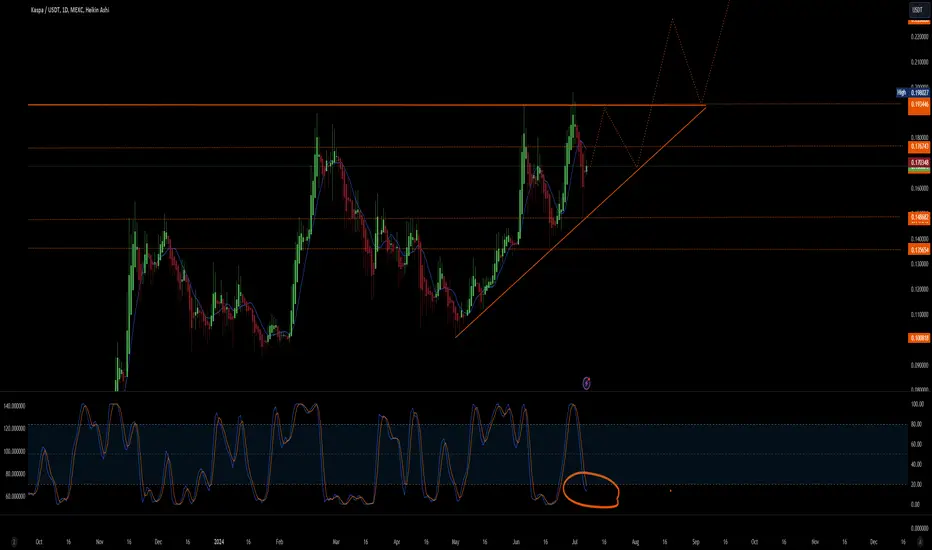
Kaspa - daily chart: The ascending triangle is getting clearer.
The chart suggests a bullish structure with the formation of an ascending triangle. At the bottom of the chart it shows a stochastic oscillator that is currently at low levels (circled in orange), suggesting that the asset may be oversold and reinforcing the upward movement. If the price manages to break the resistance at 0.198027 USDT, it is We are likely to see a continuation of the uptrend.
On the other hand, the loss of the ascending trendline could signal a possible reversal.
NextSupports: 0.1486 / 0.1351
Next Resistances: 0.1767 / 0.1934
The chart suggests a bullish structure with the formation of an ascending triangle. At the bottom of the chart it shows a stochastic oscillator that is currently at low levels (circled in orange), suggesting that the asset may be oversold and reinforcing the upward movement. If the price manages to break the resistance at 0.198027 USDT, it is We are likely to see a continuation of the uptrend.
On the other hand, the loss of the ascending trendline could signal a possible reversal.
NextSupports: 0.1486 / 0.1351
Next Resistances: 0.1767 / 0.1934

Renato Ulianov | Market Analysis & Trading
YouTube: youtube.com/@TradewithRenatoUlianov
Disclaimer: All content is for educational and informational purposes only and does not constitute financial advice.
YouTube: youtube.com/@TradewithRenatoUlianov
Disclaimer: All content is for educational and informational purposes only and does not constitute financial advice.
คำจำกัดสิทธิ์ความรับผิดชอบ
ข้อมูลและบทความไม่ได้มีวัตถุประสงค์เพื่อก่อให้เกิดกิจกรรมทางการเงิน, การลงทุน, การซื้อขาย, ข้อเสนอแนะ หรือคำแนะนำประเภทอื่น ๆ ที่ให้หรือรับรองโดย TradingView อ่านเพิ่มเติมใน ข้อกำหนดการใช้งาน
Renato Ulianov | Market Analysis & Trading
YouTube: youtube.com/@TradewithRenatoUlianov
Disclaimer: All content is for educational and informational purposes only and does not constitute financial advice.
YouTube: youtube.com/@TradewithRenatoUlianov
Disclaimer: All content is for educational and informational purposes only and does not constitute financial advice.
คำจำกัดสิทธิ์ความรับผิดชอบ
ข้อมูลและบทความไม่ได้มีวัตถุประสงค์เพื่อก่อให้เกิดกิจกรรมทางการเงิน, การลงทุน, การซื้อขาย, ข้อเสนอแนะ หรือคำแนะนำประเภทอื่น ๆ ที่ให้หรือรับรองโดย TradingView อ่านเพิ่มเติมใน ข้อกำหนดการใช้งาน