
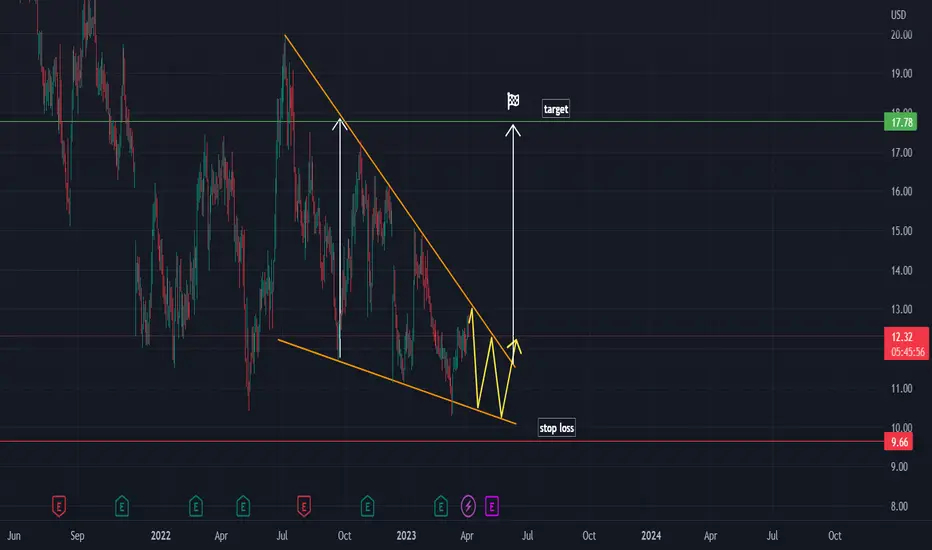
On this chart there is a falling wedge pattern.
The price is continuing to move inside the pattern.
We expect it to retest the trendline before bouncing up. Once it breaks out of the pattern it would be a good time to enter the long position.
Target and stop loss are shown on the chart.
The price is continuing to move inside the pattern.
We expect it to retest the trendline before bouncing up. Once it breaks out of the pattern it would be a good time to enter the long position.
Target and stop loss are shown on the chart.

💥 Free signals and ideas ➡ t.me/vfinvestment
คำจำกัดสิทธิ์ความรับผิดชอบ
ข้อมูลและบทความไม่ได้มีวัตถุประสงค์เพื่อก่อให้เกิดกิจกรรมทางการเงิน, การลงทุน, การซื้อขาย, ข้อเสนอแนะ หรือคำแนะนำประเภทอื่น ๆ ที่ให้หรือรับรองโดย TradingView อ่านเพิ่มเติมใน ข้อกำหนดการใช้งาน
💥 Free signals and ideas ➡ t.me/vfinvestment
คำจำกัดสิทธิ์ความรับผิดชอบ
ข้อมูลและบทความไม่ได้มีวัตถุประสงค์เพื่อก่อให้เกิดกิจกรรมทางการเงิน, การลงทุน, การซื้อขาย, ข้อเสนอแนะ หรือคำแนะนำประเภทอื่น ๆ ที่ให้หรือรับรองโดย TradingView อ่านเพิ่มเติมใน ข้อกำหนดการใช้งาน