Lumentum Holdings  LITE has tumbled some 25% over less than two months after shooting up more than 1,400% over 12 months to hit an all-time high in May. Let's see what the optical-products firm's chart and fundamentals say could happen next.
Lumentum's Fundamental Analysis
LITE designs and manufactures tech equipment dealing with optical-networking and photonics (basically, light).
The firm sells optical chips, photonic chips, parts, modules and subsystems to cloud providers and data-center and/or artificial-intelligence infrastructure operators. Lumentum also supplies a number of different types of lasers to these clients for several purposes, including 3D sensors.
Created in 2015 as a spinoff from JDSU (formerly known as JDS Uniphase), Lumentum is now viewed by most as a leader in its field.
Outside of the United States, the company maintains a presence in Canada, China, Hong Kong, Thailand, the Netherlands, Taiwan, Switzerland, Israel and Japan.
Lumentum is about six weeks out from reporting the firm's fiscal Q4 numbers, with the Street looking for $2.96 in adjusted earnings per share on $988 million of revenue.
That would represent 236% in year-over-year earnings growth on 106% in y/y revenue growth. Not too shabby.
LITE put its fiscal Q3 numbers to the tape on May 5, reporting $2.37 in adjusted earnings per share on $808.4 million of sales. Adjusted EPS beat analyst estimates, but revenues trailed expectations even though sales rose at a 90.1% annual growth rate.
Nasdaq then announced three days later that LITE would join the Nasdaq 100 index NDX on May 18, sending the stock peaking on May 15 just prior to its inclusion in the indicator. However, the stock has slowly fallen ever since.
Lumentum's Technical Analysis
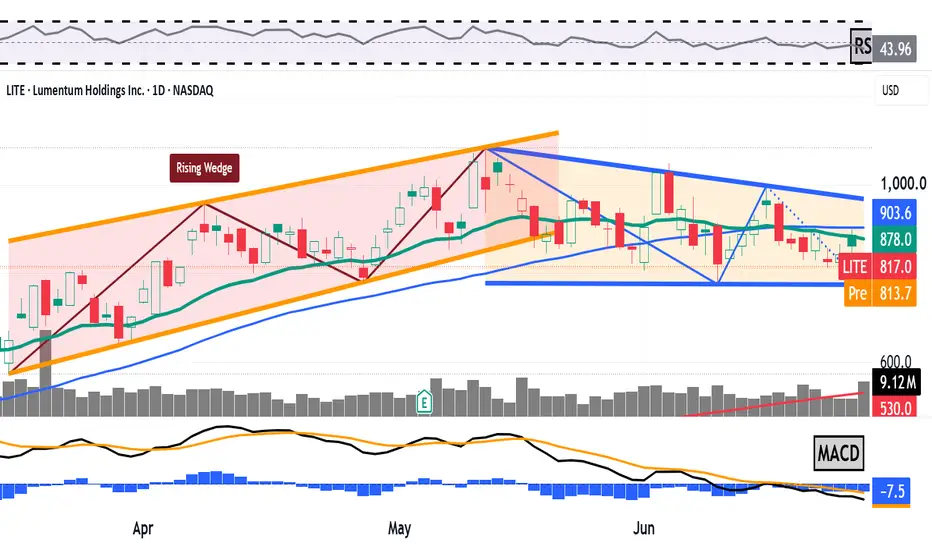
Now let's look at LITE's chart going back some four months and running through Monday morning (June 29):

Readers will first see that LITE apexed right around its May 5 earnings release and Nasdaq's May 8 news that the stock would join the Nasdaq 100.
The stock broke down at that time from a rising-wedge pattern of bearish reversal (marked with orange shading) and gave up some significant ground.
What developed next was a pennant formation (shaded in blue in the chart above) that appears to be closing.
Pennants forecasts upcoming volatility, but don't tell us in which direction a stock will move. Shares can move sharply either up or down. This pattern only tells us that when the pennant does close, it's likely Lumentum will break out explosively one way or the other.
In the meantime, the stock has recently lost both its 21-day Exponential Moving Average (or "EMA," denoted by a green line) and its 50-day Simple Moving Average (or "SMA," marked with a blue line).
Regaining these lines would be paramount to keeping going LITE's recent series of higher lows and lower highs -- a pattern that can be traded in the short-term.
Meanwhile, Lumentum's Relative Strength Index (the gray line marked "RSI" at the chart's top) is close to neutral and has not been anything else since early May. This supports my thesis that this stock could break in either direction.
At the chart's bottom, the stock's daily Moving Average Convergence Divergence indicator (or "MACD," denoted by blue bars, a black line and a gold line) is postured similarly.
All three components -- the histogram of the 9-day EMA (the blue bars), 12-day EMA (the black line) and the 26-day EMA (the gold line) -- are crowded together, and none are very far from the zero-bound. Once again, that indicates a lack of directional signaling.
(Moomoo Technologies Inc. Markets Commentator Stephen "Sarge" Guilfoyle had no position in LITE at the time of writing this column.)
This article discusses technical analysis, other approaches, including fundamental analysis, may offer very different views. The examples provided are for illustrative purposes only and are not intended to be reflective of the results you can expect to achieve. Specific security charts used are for illustrative purposes only and are not a recommendation, offer to sell, or a solicitation of an offer to buy any security. Past investment performance does not indicate or guarantee future success. Returns will vary, and all investments carry risks, including loss of principal. This content is also not a research report and is not intended to serve as the basis for any investment decision. The information contained in this article does not purport to be a complete description of the securities, markets, or developments referred to in this material. Moomoo and its affiliates make no representation or warranty as to the article's adequacy, completeness, accuracy or timeliness for any particular purpose of the above content. Furthermore, there is no guarantee that any statements, estimates, price targets, opinions or forecasts provided herein will prove to be correct.
Moomoo is a financial information and trading app offered by Moomoo Technologies Inc. In the U.S., investment products and services on Moomoo are offered by Moomoo Financial Inc., Member FINRA/SIPC.
TradingView is an independent third party not affiliated with Moomoo Financial Inc., Moomoo Technologies Inc., or its affiliates. Moomoo Financial Inc. and its affiliates do not endorse, represent or warrant the completeness and accuracy of the data and information available on the TradingView platform and are not responsible for any services provided by the third-party platform.
LITE has tumbled some 25% over less than two months after shooting up more than 1,400% over 12 months to hit an all-time high in May. Let's see what the optical-products firm's chart and fundamentals say could happen next.Lumentum's Fundamental Analysis
LITE designs and manufactures tech equipment dealing with optical-networking and photonics (basically, light).
The firm sells optical chips, photonic chips, parts, modules and subsystems to cloud providers and data-center and/or artificial-intelligence infrastructure operators. Lumentum also supplies a number of different types of lasers to these clients for several purposes, including 3D sensors.
Created in 2015 as a spinoff from JDSU (formerly known as JDS Uniphase), Lumentum is now viewed by most as a leader in its field.
Outside of the United States, the company maintains a presence in Canada, China, Hong Kong, Thailand, the Netherlands, Taiwan, Switzerland, Israel and Japan.
Lumentum is about six weeks out from reporting the firm's fiscal Q4 numbers, with the Street looking for $2.96 in adjusted earnings per share on $988 million of revenue.
That would represent 236% in year-over-year earnings growth on 106% in y/y revenue growth. Not too shabby.
LITE put its fiscal Q3 numbers to the tape on May 5, reporting $2.37 in adjusted earnings per share on $808.4 million of sales. Adjusted EPS beat analyst estimates, but revenues trailed expectations even though sales rose at a 90.1% annual growth rate.
Nasdaq then announced three days later that LITE would join the Nasdaq 100 index
NDX on May 18, sending the stock peaking on May 15 just prior to its inclusion in the indicator. However, the stock has slowly fallen ever since.Lumentum's Technical Analysis
Now let's look at LITE's chart going back some four months and running through Monday morning (June 29):
Readers will first see that LITE apexed right around its May 5 earnings release and Nasdaq's May 8 news that the stock would join the Nasdaq 100.
The stock broke down at that time from a rising-wedge pattern of bearish reversal (marked with orange shading) and gave up some significant ground.
What developed next was a pennant formation (shaded in blue in the chart above) that appears to be closing.
Pennants forecasts upcoming volatility, but don't tell us in which direction a stock will move. Shares can move sharply either up or down. This pattern only tells us that when the pennant does close, it's likely Lumentum will break out explosively one way or the other.
In the meantime, the stock has recently lost both its 21-day Exponential Moving Average (or "EMA," denoted by a green line) and its 50-day Simple Moving Average (or "SMA," marked with a blue line).
Regaining these lines would be paramount to keeping going LITE's recent series of higher lows and lower highs -- a pattern that can be traded in the short-term.
Meanwhile, Lumentum's Relative Strength Index (the gray line marked "RSI" at the chart's top) is close to neutral and has not been anything else since early May. This supports my thesis that this stock could break in either direction.
At the chart's bottom, the stock's daily Moving Average Convergence Divergence indicator (or "MACD," denoted by blue bars, a black line and a gold line) is postured similarly.
All three components -- the histogram of the 9-day EMA (the blue bars), 12-day EMA (the black line) and the 26-day EMA (the gold line) -- are crowded together, and none are very far from the zero-bound. Once again, that indicates a lack of directional signaling.
(Moomoo Technologies Inc. Markets Commentator Stephen "Sarge" Guilfoyle had no position in LITE at the time of writing this column.)
This article discusses technical analysis, other approaches, including fundamental analysis, may offer very different views. The examples provided are for illustrative purposes only and are not intended to be reflective of the results you can expect to achieve. Specific security charts used are for illustrative purposes only and are not a recommendation, offer to sell, or a solicitation of an offer to buy any security. Past investment performance does not indicate or guarantee future success. Returns will vary, and all investments carry risks, including loss of principal. This content is also not a research report and is not intended to serve as the basis for any investment decision. The information contained in this article does not purport to be a complete description of the securities, markets, or developments referred to in this material. Moomoo and its affiliates make no representation or warranty as to the article's adequacy, completeness, accuracy or timeliness for any particular purpose of the above content. Furthermore, there is no guarantee that any statements, estimates, price targets, opinions or forecasts provided herein will prove to be correct.
Moomoo is a financial information and trading app offered by Moomoo Technologies Inc. In the U.S., investment products and services on Moomoo are offered by Moomoo Financial Inc., Member FINRA/SIPC.
TradingView is an independent third party not affiliated with Moomoo Financial Inc., Moomoo Technologies Inc., or its affiliates. Moomoo Financial Inc. and its affiliates do not endorse, represent or warrant the completeness and accuracy of the data and information available on the TradingView platform and are not responsible for any services provided by the third-party platform.

คำจำกัดสิทธิ์ความรับผิดชอบ
ข้อมูลและบทความไม่ได้มีวัตถุประสงค์เพื่อก่อให้เกิดกิจกรรมทางการเงิน, การลงทุน, การซื้อขาย, ข้อเสนอแนะ หรือคำแนะนำประเภทอื่น ๆ ที่ให้หรือรับรองโดย TradingView อ่านเพิ่มเติมใน ข้อกำหนดการใช้งาน
คำจำกัดสิทธิ์ความรับผิดชอบ
ข้อมูลและบทความไม่ได้มีวัตถุประสงค์เพื่อก่อให้เกิดกิจกรรมทางการเงิน, การลงทุน, การซื้อขาย, ข้อเสนอแนะ หรือคำแนะนำประเภทอื่น ๆ ที่ให้หรือรับรองโดย TradingView อ่านเพิ่มเติมใน ข้อกำหนดการใช้งาน