
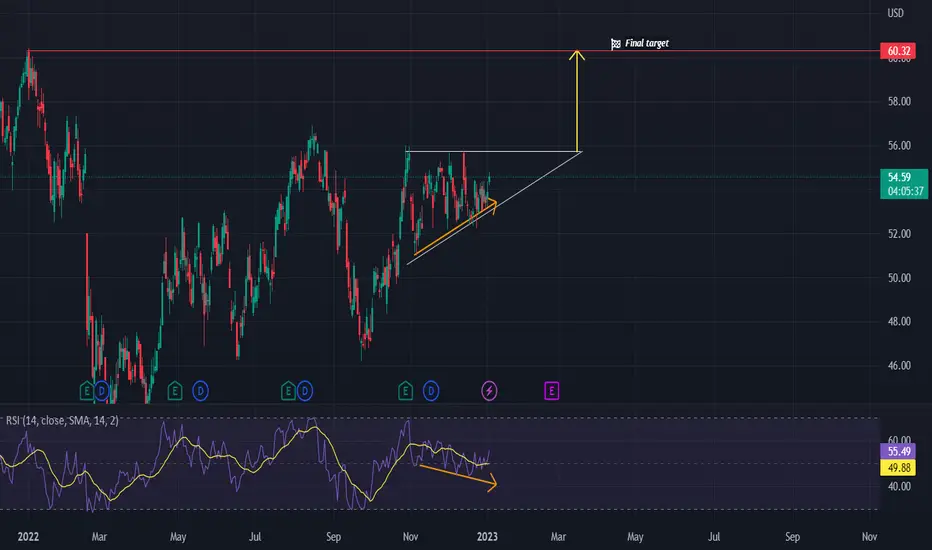
On the chart of LKQ, we can see a forming ascending triangle and we can see hidden bullish divergence on daily timeframe.
An ascending triangle is a bullish formation. The pattern gets validated when the price breaks out of the upside of the pattern.
By using the Relative Strength Index we can hidden bullish divergence.
A long position can be taken when the resistance of the triangle turns into a support.
See all further details on the chart.
Goodluck!
An ascending triangle is a bullish formation. The pattern gets validated when the price breaks out of the upside of the pattern.
By using the Relative Strength Index we can hidden bullish divergence.
A long position can be taken when the resistance of the triangle turns into a support.
See all further details on the chart.
Goodluck!
การซื้อขายยังคงดำเนินอยู่
We got a breakout and the pullback with a small fakeout and the support confirmation. LKQ is ready to continue higherบันทึก
buyers still strong.บันทึก
Strong resistance at 58-59$Expecting the price to retest 47$ again

💥 Free signals and ideas ➡ t.me/vfinvestment
การนำเสนอที่เกี่ยวข้อง
คำจำกัดสิทธิ์ความรับผิดชอบ
ข้อมูลและบทความไม่ได้มีวัตถุประสงค์เพื่อก่อให้เกิดกิจกรรมทางการเงิน, การลงทุน, การซื้อขาย, ข้อเสนอแนะ หรือคำแนะนำประเภทอื่น ๆ ที่ให้หรือรับรองโดย TradingView อ่านเพิ่มเติมใน ข้อกำหนดการใช้งาน
💥 Free signals and ideas ➡ t.me/vfinvestment
การนำเสนอที่เกี่ยวข้อง
คำจำกัดสิทธิ์ความรับผิดชอบ
ข้อมูลและบทความไม่ได้มีวัตถุประสงค์เพื่อก่อให้เกิดกิจกรรมทางการเงิน, การลงทุน, การซื้อขาย, ข้อเสนอแนะ หรือคำแนะนำประเภทอื่น ๆ ที่ให้หรือรับรองโดย TradingView อ่านเพิ่มเติมใน ข้อกำหนดการใช้งาน