Long
LRCUSDT - Dailly analysis
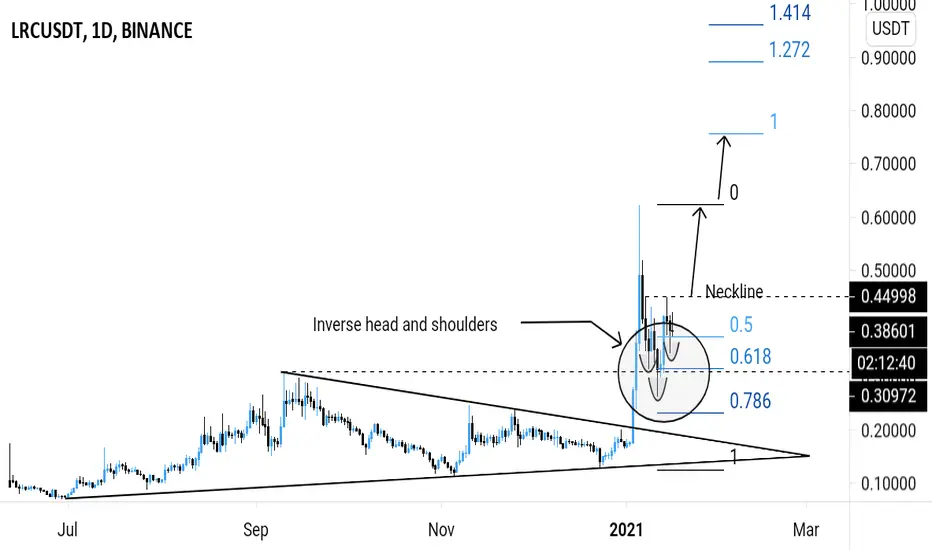
LRCUSDT brokeout above the symmetrical triangle pattern as expected from my previous analysis.
Price hit the ATH and retraced.
Price is testing the flip horizontal support + 0.618 fibonacci retracement level.
A bullish pin bar ( hammer ) was formed on the Daily timeframe.
Price action is printing the inverse head and shoulders reversal pattern.
Possible uptrend continuation.
Buy entry ⬆️ - breakout above the inverse head and shoulders neckline resistance.
Targets 🎯 - previous swing high (ATH), fibonacci extension levels.
Setup invalidation ❌ - breakdown below the inverse shoulders support level.
Price hit the ATH and retraced.
Price is testing the flip horizontal support + 0.618 fibonacci retracement level.
A bullish pin bar ( hammer ) was formed on the Daily timeframe.
Price action is printing the inverse head and shoulders reversal pattern.
Possible uptrend continuation.
Buy entry ⬆️ - breakout above the inverse head and shoulders neckline resistance.
Targets 🎯 - previous swing high (ATH), fibonacci extension levels.
Setup invalidation ❌ - breakdown below the inverse shoulders support level.

การนำเสนอที่เกี่ยวข้อง
คำจำกัดสิทธิ์ความรับผิดชอบ
ข้อมูลและบทความไม่ได้มีวัตถุประสงค์เพื่อก่อให้เกิดกิจกรรมทางการเงิน, การลงทุน, การซื้อขาย, ข้อเสนอแนะ หรือคำแนะนำประเภทอื่น ๆ ที่ให้หรือรับรองโดย TradingView อ่านเพิ่มเติมใน ข้อกำหนดการใช้งาน
การนำเสนอที่เกี่ยวข้อง
คำจำกัดสิทธิ์ความรับผิดชอบ
ข้อมูลและบทความไม่ได้มีวัตถุประสงค์เพื่อก่อให้เกิดกิจกรรมทางการเงิน, การลงทุน, การซื้อขาย, ข้อเสนอแนะ หรือคำแนะนำประเภทอื่น ๆ ที่ให้หรือรับรองโดย TradingView อ่านเพิ่มเติมใน ข้อกำหนดการใช้งาน