
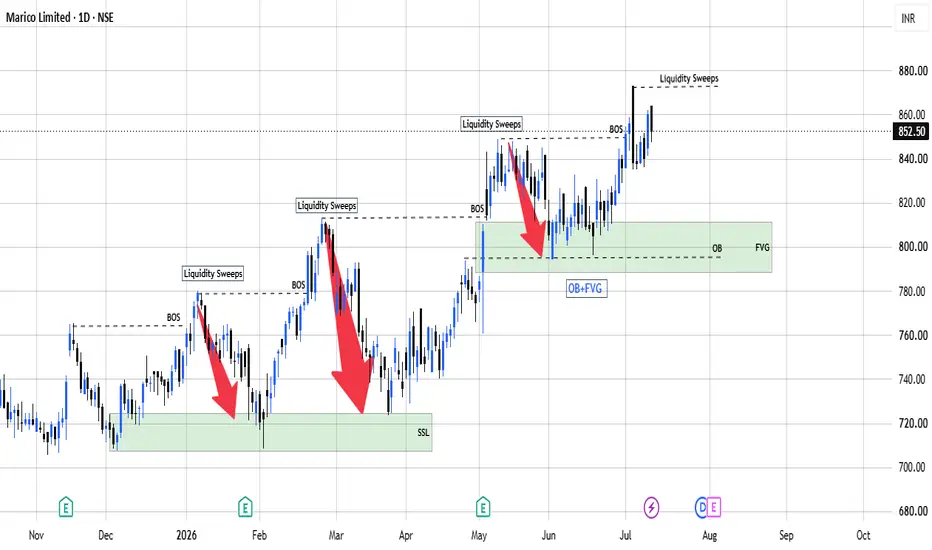
This daily chart for Marico Limited illustrates a recurring cycle of price action based on liquidity manipulation:
Current Price: The stock is trading at 852.50, down -7.55 (-0.88%).
Key Technical Patterns:
Liquidity Sweeps: The chart explicitly labels multiple instances where the price pushes above a previous high to "sweep" liquidity before reversing downward.
BOS (Break of Structure): These points signify confirmed shifts in market structure following the liquidity sweeps.
Demand/Support Zones: The chart identifies green-shaded SSL (Sell Side Liquidity) and OB+FVG (Order Block + Fair Value Gap) zones. These areas serve as key reversal points where the price has historically found support after being driven down from liquidity sweeps.
The recurring pattern demonstrates a clear strategy of trapping retail traders at liquidity sweeps before initiating a move toward the designated support zones.
If you find this helpful, please be sure to like and leave a comment.
Current Price: The stock is trading at 852.50, down -7.55 (-0.88%).
Key Technical Patterns:
Liquidity Sweeps: The chart explicitly labels multiple instances where the price pushes above a previous high to "sweep" liquidity before reversing downward.
BOS (Break of Structure): These points signify confirmed shifts in market structure following the liquidity sweeps.
Demand/Support Zones: The chart identifies green-shaded SSL (Sell Side Liquidity) and OB+FVG (Order Block + Fair Value Gap) zones. These areas serve as key reversal points where the price has historically found support after being driven down from liquidity sweeps.
The recurring pattern demonstrates a clear strategy of trapping retail traders at liquidity sweeps before initiating a move toward the designated support zones.
If you find this helpful, please be sure to like and leave a comment.

คำจำกัดสิทธิ์ความรับผิดชอบ
ข้อมูลและบทความไม่ได้มีวัตถุประสงค์เพื่อก่อให้เกิดกิจกรรมทางการเงิน, การลงทุน, การซื้อขาย, ข้อเสนอแนะ หรือคำแนะนำประเภทอื่น ๆ ที่ให้หรือรับรองโดย TradingView อ่านเพิ่มเติมใน ข้อกำหนดการใช้งาน
คำจำกัดสิทธิ์ความรับผิดชอบ
ข้อมูลและบทความไม่ได้มีวัตถุประสงค์เพื่อก่อให้เกิดกิจกรรมทางการเงิน, การลงทุน, การซื้อขาย, ข้อเสนอแนะ หรือคำแนะนำประเภทอื่น ๆ ที่ให้หรือรับรองโดย TradingView อ่านเพิ่มเติมใน ข้อกำหนดการใช้งาน