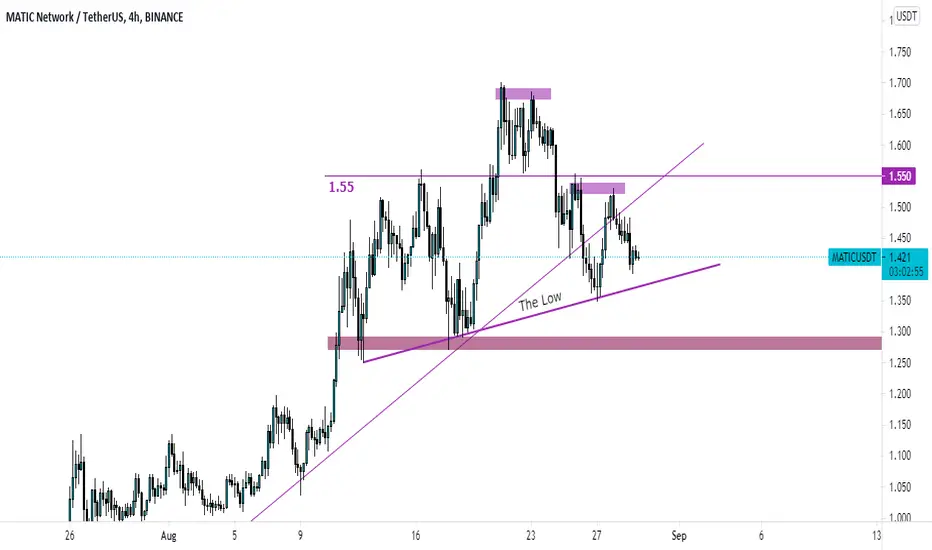
$MATIC forming Head & Shoulder pattern
After a slight rebound,
#MATIC reached its resistance zone facing the selling price.
The price seems to form an H&S (head and shoulders) pattern, which is bearish.
Well, until the price does not break below the low (marked in the chart), everything is fine.
Potentially, prices may also rebound from the small trend line.
#MATIC reached its resistance zone facing the selling price.
The price seems to form an H&S (head and shoulders) pattern, which is bearish.
Well, until the price does not break below the low (marked in the chart), everything is fine.
Potentially, prices may also rebound from the small trend line.

iSmashProfit
การนำเสนอที่เกี่ยวข้อง
คำจำกัดสิทธิ์ความรับผิดชอบ
ข้อมูลและบทความไม่ได้มีวัตถุประสงค์เพื่อก่อให้เกิดกิจกรรมทางการเงิน, การลงทุน, การซื้อขาย, ข้อเสนอแนะ หรือคำแนะนำประเภทอื่น ๆ ที่ให้หรือรับรองโดย TradingView อ่านเพิ่มเติมใน ข้อกำหนดการใช้งาน
iSmashProfit
การนำเสนอที่เกี่ยวข้อง
คำจำกัดสิทธิ์ความรับผิดชอบ
ข้อมูลและบทความไม่ได้มีวัตถุประสงค์เพื่อก่อให้เกิดกิจกรรมทางการเงิน, การลงทุน, การซื้อขาย, ข้อเสนอแนะ หรือคำแนะนำประเภทอื่น ๆ ที่ให้หรือรับรองโดย TradingView อ่านเพิ่มเติมใน ข้อกำหนดการใช้งาน