Polygon (MATIC) - August 21
Hello?
Welcome, traders.
If you "follow", you can always get new information quickly.
Please also click "Like".
Have a good day.
-------------------------------------
(MATICUSDT 1W Chart)

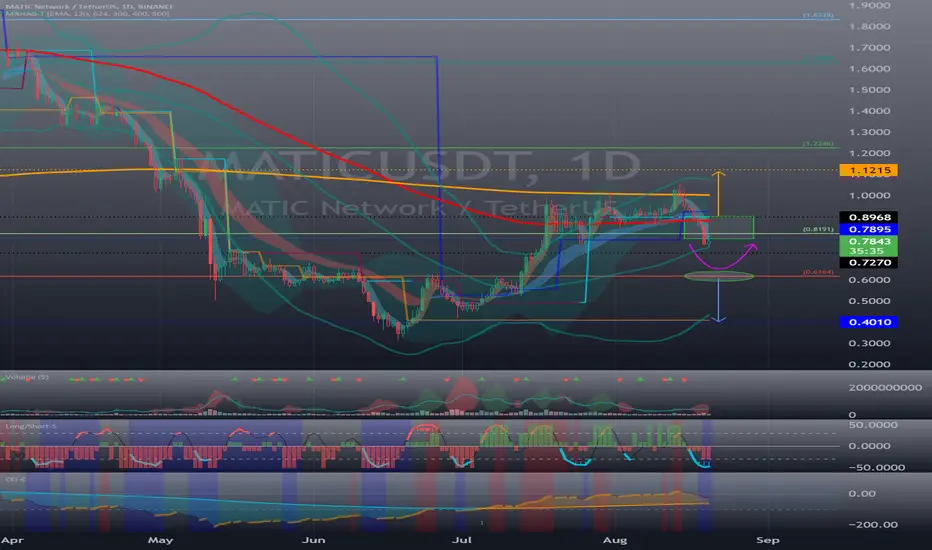
The key is whether the 0.6164-0.8191 section can support and rise.
(1D chart)
We need to see if we can quickly rise above 0.8191.
If it doesn't, there's a good chance it will drop below 0.7270.
Holding the price above 0.6164 is expected to lead to an attempt to move higher above 0.8191.
------------------------------------------------------------ -------------------------------------------
** All descriptions are for reference only and do not guarantee a profit or loss in investment.
** The MRHAB-T indicator, which is inactive on the chart, contains indicators that indicate support and resistance points.
** Background color of Long/Short-S indicator: RSI oversold and overbought sections
** Background color of CCI-C indicator: When the short-term CCI line is below -100 and above +100, oversold and overbought sections are displayed.
** The OBV indicator was re-created by applying a formula to the DepthHouse Trading indicator, an indicator disclosed by oh92. (Thanks for this.)
(Short-term Stop Loss can be said to be a point where profit and loss can be preserved or additional entry through split trading. It is a short-term investment perspective.)
---------------------------------
Welcome, traders.
If you "follow", you can always get new information quickly.
Please also click "Like".
Have a good day.
-------------------------------------
(MATICUSDT 1W Chart)
The key is whether the 0.6164-0.8191 section can support and rise.
(1D chart)
We need to see if we can quickly rise above 0.8191.
If it doesn't, there's a good chance it will drop below 0.7270.
Holding the price above 0.6164 is expected to lead to an attempt to move higher above 0.8191.
------------------------------------------------------------ -------------------------------------------
** All descriptions are for reference only and do not guarantee a profit or loss in investment.
** The MRHAB-T indicator, which is inactive on the chart, contains indicators that indicate support and resistance points.
** Background color of Long/Short-S indicator: RSI oversold and overbought sections
** Background color of CCI-C indicator: When the short-term CCI line is below -100 and above +100, oversold and overbought sections are displayed.
** The OBV indicator was re-created by applying a formula to the DepthHouse Trading indicator, an indicator disclosed by oh92. (Thanks for this.)
(Short-term Stop Loss can be said to be a point where profit and loss can be preserved or additional entry through split trading. It is a short-term investment perspective.)
---------------------------------

[Practical trading strategy using HA-MS and SBOD]
youtu.be/aceN1AttX1Y
[Binance Futures Message Channel]
t.me/readcryptobns
[업비트 메시지 채널]
t.me/readcryptoubt
youtu.be/aceN1AttX1Y
[Binance Futures Message Channel]
t.me/readcryptobns
[업비트 메시지 채널]
t.me/readcryptoubt
การนำเสนอที่เกี่ยวข้อง
คำจำกัดสิทธิ์ความรับผิดชอบ
ข้อมูลและบทความไม่ได้มีวัตถุประสงค์เพื่อก่อให้เกิดกิจกรรมทางการเงิน, การลงทุน, การซื้อขาย, ข้อเสนอแนะ หรือคำแนะนำประเภทอื่น ๆ ที่ให้หรือรับรองโดย TradingView อ่านเพิ่มเติมใน ข้อกำหนดการใช้งาน
[Practical trading strategy using HA-MS and SBOD]
youtu.be/aceN1AttX1Y
[Binance Futures Message Channel]
t.me/readcryptobns
[업비트 메시지 채널]
t.me/readcryptoubt
youtu.be/aceN1AttX1Y
[Binance Futures Message Channel]
t.me/readcryptobns
[업비트 메시지 채널]
t.me/readcryptoubt
การนำเสนอที่เกี่ยวข้อง
คำจำกัดสิทธิ์ความรับผิดชอบ
ข้อมูลและบทความไม่ได้มีวัตถุประสงค์เพื่อก่อให้เกิดกิจกรรมทางการเงิน, การลงทุน, การซื้อขาย, ข้อเสนอแนะ หรือคำแนะนำประเภทอื่น ๆ ที่ให้หรือรับรองโดย TradingView อ่านเพิ่มเติมใน ข้อกำหนดการใช้งาน