
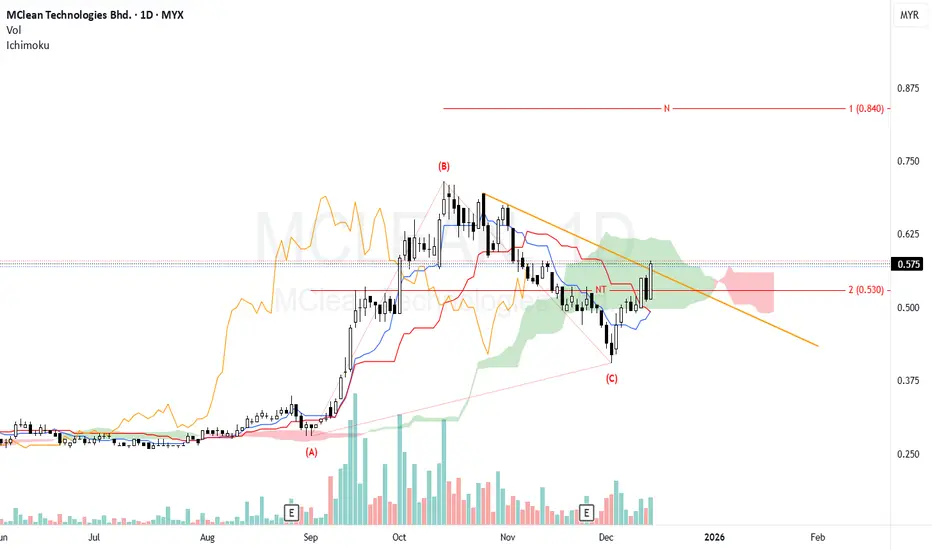
N wave with N & NT projection
Price is above Tenkan sen & Kijun sen and now testing the Kumo from below.
A daily close above the Kumo (~0.58–0.60) would confirm a trend transition to bullish.
Chikou Span is approaching price candles; clearance above historical price would further strengthen the bullish bias.
A downtrend line from the B peak is being tested/barely penetrated.
Volume: pickup on recent recovery bars — supportive for continuation if sustained.
Short–medium bias: cautiously bullish while price holds above NT (0.53). A clean daily close above the downtrend line and local resistance (0.58–0.60) would increase the chance of the N projection playing out.
If price fails to hold above NT (0.53) on a daily close, the bullish count weakens and a retest of the C area (0.38–0.42) becomes more likely.
Ichimoku: neutral→mildly bullish as long as price stays above Tenkan/Kijun and the Kumo's lower edge remains intact.
Support
0.530 – NT projection & immediate structural support
0.500 – psychological and prior demand zone
0.470–0.480 – failure level (below corrective low)
Resistance
0.580–0.600 – Kumo resistance & downtrend line
0.650–0.680 – previous supply zone
0.840 – N-wave target (major resistance)
Entry: take a position after a confirmed daily close above the trendline and ~0.58–0.60 with volume confirmation.
Stop: just below NT — ~0.52–0.525 (or 0.53 for tighter risk).
Invalidate bullish plan on a daily close below 0.53 with rising volume — then consider flat/short or wait for structural recovery.
Size position so stop loss equals your predefined % risk. Trail stops to Tenkan/Kijun as price advances.
Note:
1. Analysis for education purpose only.
2. Trade at your own risk.
Price is above Tenkan sen & Kijun sen and now testing the Kumo from below.
A daily close above the Kumo (~0.58–0.60) would confirm a trend transition to bullish.
Chikou Span is approaching price candles; clearance above historical price would further strengthen the bullish bias.
A downtrend line from the B peak is being tested/barely penetrated.
Volume: pickup on recent recovery bars — supportive for continuation if sustained.
Short–medium bias: cautiously bullish while price holds above NT (0.53). A clean daily close above the downtrend line and local resistance (0.58–0.60) would increase the chance of the N projection playing out.
If price fails to hold above NT (0.53) on a daily close, the bullish count weakens and a retest of the C area (0.38–0.42) becomes more likely.
Ichimoku: neutral→mildly bullish as long as price stays above Tenkan/Kijun and the Kumo's lower edge remains intact.
Support
0.530 – NT projection & immediate structural support
0.500 – psychological and prior demand zone
0.470–0.480 – failure level (below corrective low)
Resistance
0.580–0.600 – Kumo resistance & downtrend line
0.650–0.680 – previous supply zone
0.840 – N-wave target (major resistance)
Entry: take a position after a confirmed daily close above the trendline and ~0.58–0.60 with volume confirmation.
Stop: just below NT — ~0.52–0.525 (or 0.53 for tighter risk).
Invalidate bullish plan on a daily close below 0.53 with rising volume — then consider flat/short or wait for structural recovery.
Size position so stop loss equals your predefined % risk. Trail stops to Tenkan/Kijun as price advances.
Note:
1. Analysis for education purpose only.
2. Trade at your own risk.

คำจำกัดสิทธิ์ความรับผิดชอบ
ข้อมูลและบทความไม่ได้มีวัตถุประสงค์เพื่อก่อให้เกิดกิจกรรมทางการเงิน, การลงทุน, การซื้อขาย, ข้อเสนอแนะ หรือคำแนะนำประเภทอื่น ๆ ที่ให้หรือรับรองโดย TradingView อ่านเพิ่มเติมใน ข้อกำหนดการใช้งาน
คำจำกัดสิทธิ์ความรับผิดชอบ
ข้อมูลและบทความไม่ได้มีวัตถุประสงค์เพื่อก่อให้เกิดกิจกรรมทางการเงิน, การลงทุน, การซื้อขาย, ข้อเสนอแนะ หรือคำแนะนำประเภทอื่น ๆ ที่ให้หรือรับรองโดย TradingView อ่านเพิ่มเติมใน ข้อกำหนดการใช้งาน