MCOUSD
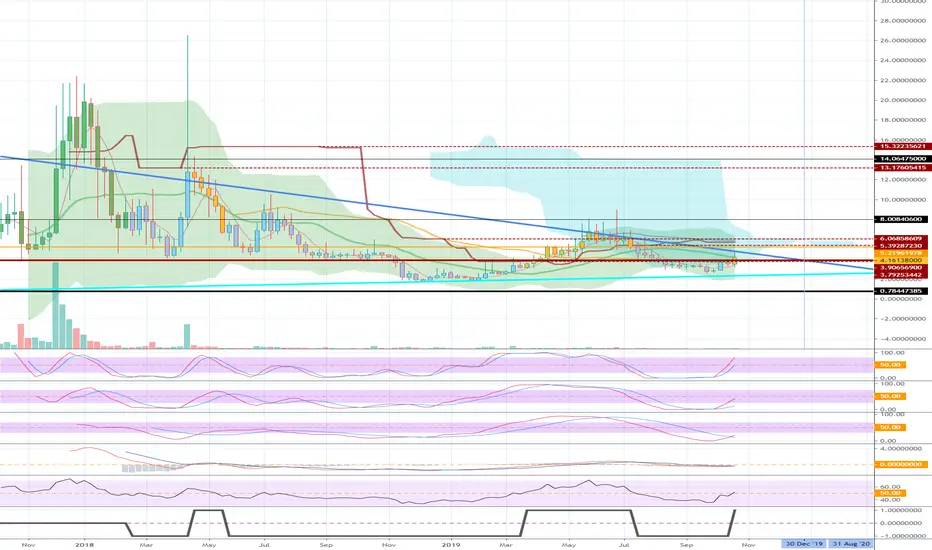
The MCO, a chart published for next year's profits, also rose above the basic 3.90656900 following the rise in BTC.
The price is currently forming around 20MA on the weekly chart.
Once the downtrend line is out and the stock splits slowly between the uptrend line and 3.90656900, we expect good results next year.
The price is currently forming around 20MA on the weekly chart.
Once the downtrend line is out and the stock splits slowly between the uptrend line and 3.90656900, we expect good results next year.

[Practical trading strategy using HA-MS and SBOD]
youtu.be/aceN1AttX1Y
youtu.be/aceN1AttX1Y
การนำเสนอที่เกี่ยวข้อง
คำจำกัดสิทธิ์ความรับผิดชอบ
ข้อมูลและบทความไม่ได้มีวัตถุประสงค์เพื่อก่อให้เกิดกิจกรรมทางการเงิน, การลงทุน, การซื้อขาย, ข้อเสนอแนะ หรือคำแนะนำประเภทอื่น ๆ ที่ให้หรือรับรองโดย TradingView อ่านเพิ่มเติมใน ข้อกำหนดการใช้งาน