MESM May 27: Hold 7537 for 7570, lose it watch 7516
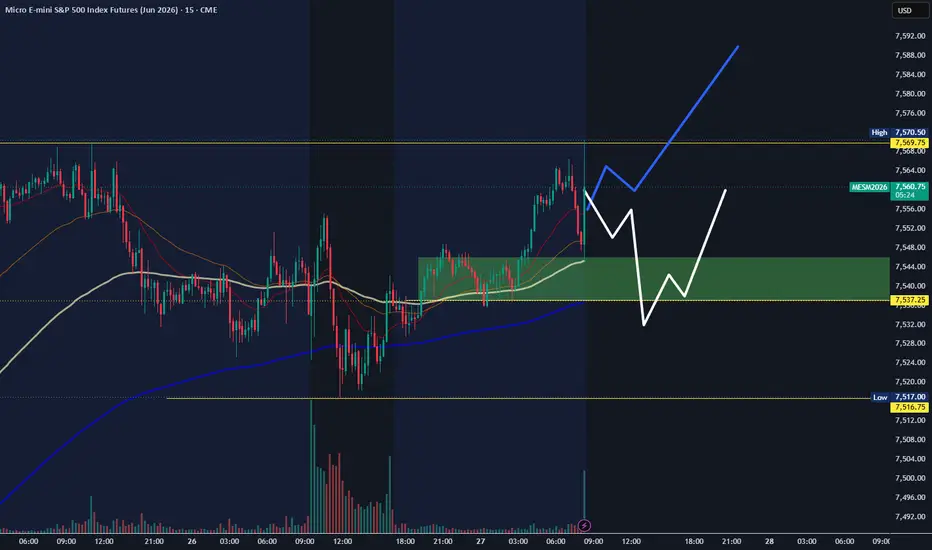
MESM analysis for Wednesday, May 27
MESM is trading around 7545 after an overnight consolidation, and for me the key level today is 7537.
On the 4H chart, if I want to stay bullish, then I do not want to see a 4H candle close below 7537. As long as price holds above that level, I’m still watching for continuation toward the previous all-time high around 7570.
If price starts closing below 7537, then I think a deeper pullback can develop, with the first downside target around 7516.
On the 1H chart, there is a cluster zone inside the green highlighted area where the 1-hour structure lines up with the higher-time-frame support. That makes the green zone an important reaction area if price pulls back.
On the 15M chart, the structure still supports the same idea. If price trades back into the green highlighted zone, I’ll be watching closely for a reaction and possible buy setup there.
Key levels
7570 = previous all-time high / upside target
7537 = must-hold support
7516 = downside gap-fill target
Green zone = 1H + 4H cluster support
So for today, my plan is:
Stay constructive while price holds 7537
Watch for continuation toward 7570
If 7537 fails, watch for pullback toward 7516
Pay attention to the green support zone for reaction
Not financial advice. No confirmation, no trade. MESM2026
MESM is trading around 7545 after an overnight consolidation, and for me the key level today is 7537.
On the 4H chart, if I want to stay bullish, then I do not want to see a 4H candle close below 7537. As long as price holds above that level, I’m still watching for continuation toward the previous all-time high around 7570.
If price starts closing below 7537, then I think a deeper pullback can develop, with the first downside target around 7516.
On the 1H chart, there is a cluster zone inside the green highlighted area where the 1-hour structure lines up with the higher-time-frame support. That makes the green zone an important reaction area if price pulls back.
On the 15M chart, the structure still supports the same idea. If price trades back into the green highlighted zone, I’ll be watching closely for a reaction and possible buy setup there.
Key levels
7570 = previous all-time high / upside target
7537 = must-hold support
7516 = downside gap-fill target
Green zone = 1H + 4H cluster support
So for today, my plan is:
Stay constructive while price holds 7537
Watch for continuation toward 7570
If 7537 fails, watch for pullback toward 7516
Pay attention to the green support zone for reaction
Not financial advice. No confirmation, no trade.
MESM2026 
คำจำกัดสิทธิ์ความรับผิดชอบ
ข้อมูลและบทความไม่ได้มีวัตถุประสงค์เพื่อก่อให้เกิดกิจกรรมทางการเงิน, การลงทุน, การซื้อขาย, ข้อเสนอแนะ หรือคำแนะนำประเภทอื่น ๆ ที่ให้หรือรับรองโดย TradingView อ่านเพิ่มเติมใน ข้อกำหนดการใช้งาน
คำจำกัดสิทธิ์ความรับผิดชอบ
ข้อมูลและบทความไม่ได้มีวัตถุประสงค์เพื่อก่อให้เกิดกิจกรรมทางการเงิน, การลงทุน, การซื้อขาย, ข้อเสนอแนะ หรือคำแนะนำประเภทอื่น ๆ ที่ให้หรือรับรองโดย TradingView อ่านเพิ่มเติมใน ข้อกำหนดการใช้งาน