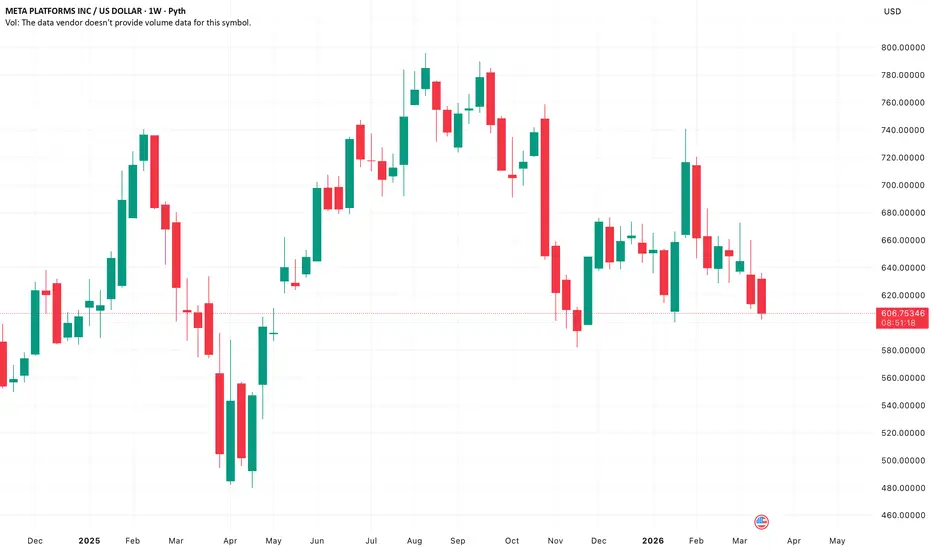
Meta Platforms (META) is trading around $606.00, remaining under pressure as the stock continues to move within a global corrective structure.
⸻
Market Structure
On the daily timeframe, META is forming a broadening pattern with dynamic boundaries between $800 and $620.
• Price is currently below the key $620 support, confirming bearish dominance
• The structure suggests continuation of a corrective downtrend
On the H4 timeframe:
• Price is approaching the $600 level, a previous local low
• A breakdown may trigger further downside acceleration
However, a move above $630–631 could shift momentum back into a corrective rebound.
⸻
Technical Signals
Indicators confirm bearish momentum:
• Alligator indicator: fast EMAs below signal line (bearish alignment)
• Awesome Oscillator: below zero, forming negative bars
• No signs of reversal yet
This setup supports continuation of the downtrend unless key resistance is reclaimed.
⸻
Key Levels
Resistance
• 631.00
• 684.00
Support
• 588.00
• 530.00
⸻
Trading Scenarios
Bearish Scenario
Sell below 588.00
• Entry: 587.95
• Target: 530.00
• Stop-loss: 610.00
• Timeframe: 7+ days
Breakdown confirms continuation of bearish impulse.
⸻
Bullish Scenario
Buy above 631.00
• Entry: 631.05
• Target: 684.00
• Stop-loss: 610.00
Recovery above resistance signals shift into corrective upside.
⸻
Outlook
META remains in a bearish corrective phase, with price below key structural support. The $588 breakdown level is critical for continuation lower, while only a move above $631 would weaken bearish pressure.
⸻
Market Structure
On the daily timeframe, META is forming a broadening pattern with dynamic boundaries between $800 and $620.
• Price is currently below the key $620 support, confirming bearish dominance
• The structure suggests continuation of a corrective downtrend
On the H4 timeframe:
• Price is approaching the $600 level, a previous local low
• A breakdown may trigger further downside acceleration
However, a move above $630–631 could shift momentum back into a corrective rebound.
⸻
Technical Signals
Indicators confirm bearish momentum:
• Alligator indicator: fast EMAs below signal line (bearish alignment)
• Awesome Oscillator: below zero, forming negative bars
• No signs of reversal yet
This setup supports continuation of the downtrend unless key resistance is reclaimed.
⸻
Key Levels
Resistance
• 631.00
• 684.00
Support
• 588.00
• 530.00
⸻
Trading Scenarios
Bearish Scenario
Sell below 588.00
• Entry: 587.95
• Target: 530.00
• Stop-loss: 610.00
• Timeframe: 7+ days
Breakdown confirms continuation of bearish impulse.
⸻
Bullish Scenario
Buy above 631.00
• Entry: 631.05
• Target: 684.00
• Stop-loss: 610.00
Recovery above resistance signals shift into corrective upside.
⸻
Outlook
META remains in a bearish corrective phase, with price below key structural support. The $588 breakdown level is critical for continuation lower, while only a move above $631 would weaken bearish pressure.

คำจำกัดสิทธิ์ความรับผิดชอบ
ข้อมูลและบทความไม่ได้มีวัตถุประสงค์เพื่อก่อให้เกิดกิจกรรมทางการเงิน, การลงทุน, การซื้อขาย, ข้อเสนอแนะ หรือคำแนะนำประเภทอื่น ๆ ที่ให้หรือรับรองโดย TradingView อ่านเพิ่มเติมใน ข้อกำหนดการใช้งาน
คำจำกัดสิทธิ์ความรับผิดชอบ
ข้อมูลและบทความไม่ได้มีวัตถุประสงค์เพื่อก่อให้เกิดกิจกรรมทางการเงิน, การลงทุน, การซื้อขาย, ข้อเสนอแนะ หรือคำแนะนำประเภทอื่น ๆ ที่ให้หรือรับรองโดย TradingView อ่านเพิ่มเติมใน ข้อกำหนดการใช้งาน