
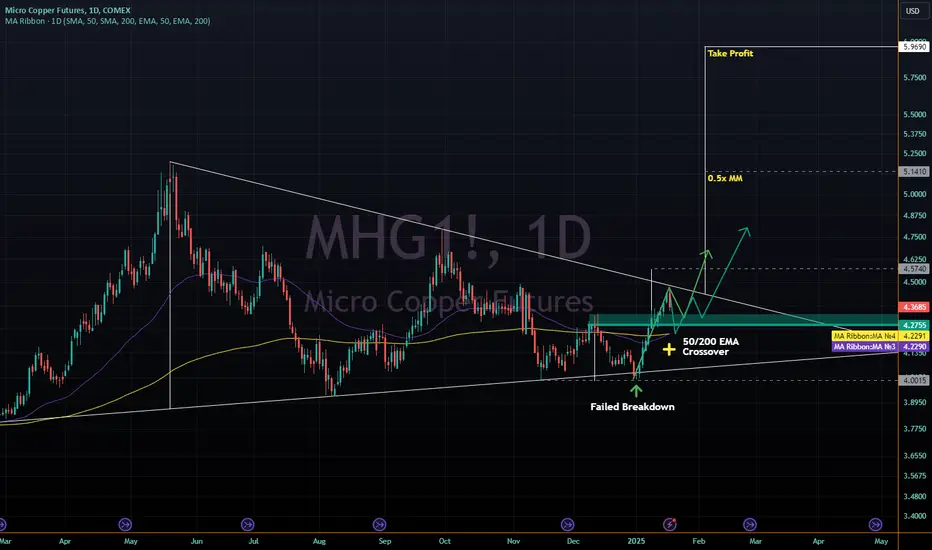
The daily chart should be headed to ~5 and then ~6 dollars give or take. It already has a confirmed double bottom that is currently re-testing its neck after reaching the top of the larger wedge here and getting stopped there.
If LTFs moves down to re-test 4.27 or even a pullback below it around the EMAs occurs, and these levels are held or reclaimed as supports, that would be a successful re-test of the double-bottom's neckline.
That double-bottom's initial target would lead to a breakout of the larger wedge, after a failed breakdown (making it more likely already).
A daily wedge break targets $5.97 as its initial take profit target, around $5.14 as the halfway point towards it.
Good luck!
If LTFs moves down to re-test 4.27 or even a pullback below it around the EMAs occurs, and these levels are held or reclaimed as supports, that would be a successful re-test of the double-bottom's neckline.
That double-bottom's initial target would lead to a breakout of the larger wedge, after a failed breakdown (making it more likely already).
A daily wedge break targets $5.97 as its initial take profit target, around $5.14 as the halfway point towards it.
Good luck!
การซื้อขายยังคงดำเนินอยู่
Bounced from the 50/200 EMA crossover, held support on the daily close/open, now testing top of support - looking for potentially one more test of bottom of support around 4.2755 ish, or it may move up sooner instead. Longer-term - look for a move above 4.45ish to confirm the larger move up towards 6บันทึก
Reached the 0.5x measured move and moved a bit above it:
คำจำกัดสิทธิ์ความรับผิดชอบ
ข้อมูลและบทความไม่ได้มีวัตถุประสงค์เพื่อก่อให้เกิดกิจกรรมทางการเงิน, การลงทุน, การซื้อขาย, ข้อเสนอแนะ หรือคำแนะนำประเภทอื่น ๆ ที่ให้หรือรับรองโดย TradingView อ่านเพิ่มเติมใน ข้อกำหนดการใช้งาน
คำจำกัดสิทธิ์ความรับผิดชอบ
ข้อมูลและบทความไม่ได้มีวัตถุประสงค์เพื่อก่อให้เกิดกิจกรรมทางการเงิน, การลงทุน, การซื้อขาย, ข้อเสนอแนะ หรือคำแนะนำประเภทอื่น ๆ ที่ให้หรือรับรองโดย TradingView อ่านเพิ่มเติมใน ข้อกำหนดการใช้งาน