Short
Maker
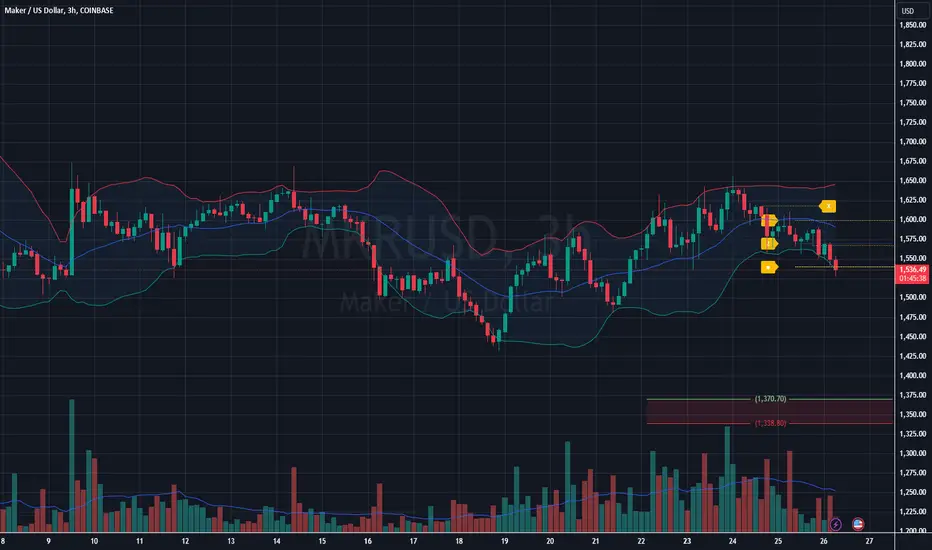
- The price has consistently made lower highs and lower lows, indicating sustained bearish momentum.
- The bands are expanding, which indicates an increase in volatility.
- There seems to be a 20-period moving average (middle line of the Bollinger Bands), which the price recently crossed below. This signals bearish momentum.
- There are a few spikes in volume, particularly during the large price drops. This increase in volume during sell-offs suggests strong selling pressure.
- Support: The nearest support is around $1,431.81, which is the lowest price visible in the chart. If the price breaks below this level, it may head towards lower support zones.
- Bearish Bias: The price action, moving averages, and positioning near the lower Bollinger Band suggest a bearish trend.

➀➁➂➃➄
คำจำกัดสิทธิ์ความรับผิดชอบ
ข้อมูลและบทความไม่ได้มีวัตถุประสงค์เพื่อก่อให้เกิดกิจกรรมทางการเงิน, การลงทุน, การซื้อขาย, ข้อเสนอแนะ หรือคำแนะนำประเภทอื่น ๆ ที่ให้หรือรับรองโดย TradingView อ่านเพิ่มเติมใน ข้อกำหนดการใช้งาน
➀➁➂➃➄
คำจำกัดสิทธิ์ความรับผิดชอบ
ข้อมูลและบทความไม่ได้มีวัตถุประสงค์เพื่อก่อให้เกิดกิจกรรมทางการเงิน, การลงทุน, การซื้อขาย, ข้อเสนอแนะ หรือคำแนะนำประเภทอื่น ๆ ที่ให้หรือรับรองโดย TradingView อ่านเพิ่มเติมใน ข้อกำหนดการใช้งาน