
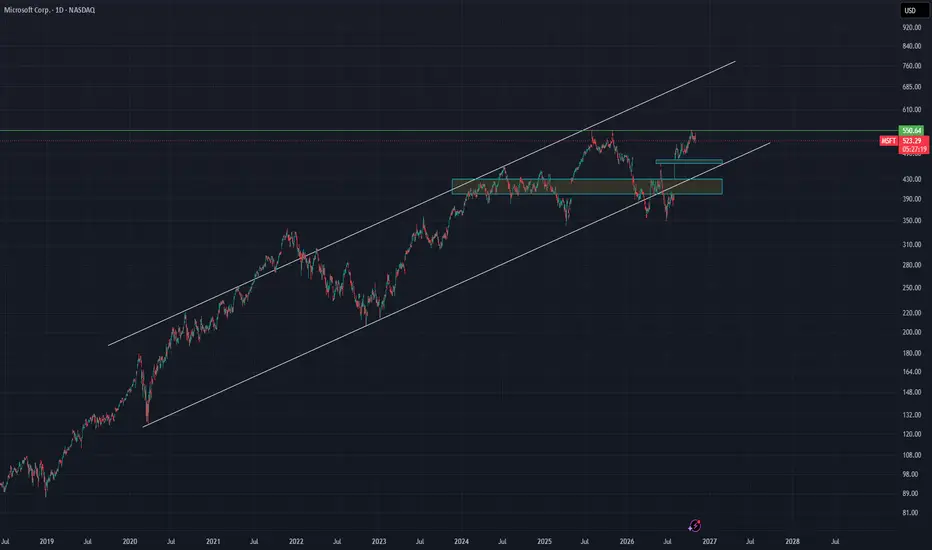
**MSFT: Rising Channel and Key Gap Supports**
Microsoft (MSFT) continues to maintain its long-term bullish structure on the daily chart. Price remains within the broad ascending channel that has guided the primary trend since 2020, while the sequence of higher major lows suggests that the broader upward direction has not yet been structurally damaged.
The stock is currently trading near **$521.94**, just below the major horizontal resistance at **$550.64**. This level has previously attracted selling pressure and therefore represents the principal breakout threshold. A confirmed daily close above $550.64 could support a continuation toward **$580–$600**, followed by the upper section of the long-term rising channel. Until this breakout occurs, short-term consolidation or profit-taking beneath resistance remains possible.
The first immediate support area is located around **$500–$510**. Below this region, the most recent bullish price gap at approximately **$455–$465** becomes technically important. This gap also converges with the rising lower boundary of the long-term channel, creating a strong confluence zone. A controlled pullback into this area followed by renewed buying pressure would be consistent with a healthy retest rather than a deterioration of the main trend.
The broader unfilled price gap between approximately **$400 and $430** represents the secondary support zone. If the first gap and the rising channel support fail, price may be drawn toward this lower imbalance area. The upper section near $425–$430 would be the first possible reaction point, while a full gap-fill could extend the correction toward **$400–$405**. A sustained break below $390 would weaken the long-term bullish structure and expose the **$350–$360 region**.
Although unfilled gaps can act as price magnets, they are not required to be closed, and no precise timing can be assigned to a potential gap-fill. As long as MSFT holds above the rising channel and the $455–$465 support zone, the primary trend remains positive. The two decisive levels are therefore **$550.64 on the upside** and approximately **$455 on the downside**.
*This analysis is for informational purposes only and does not constitute investment advice.*
Microsoft (MSFT) continues to maintain its long-term bullish structure on the daily chart. Price remains within the broad ascending channel that has guided the primary trend since 2020, while the sequence of higher major lows suggests that the broader upward direction has not yet been structurally damaged.
The stock is currently trading near **$521.94**, just below the major horizontal resistance at **$550.64**. This level has previously attracted selling pressure and therefore represents the principal breakout threshold. A confirmed daily close above $550.64 could support a continuation toward **$580–$600**, followed by the upper section of the long-term rising channel. Until this breakout occurs, short-term consolidation or profit-taking beneath resistance remains possible.
The first immediate support area is located around **$500–$510**. Below this region, the most recent bullish price gap at approximately **$455–$465** becomes technically important. This gap also converges with the rising lower boundary of the long-term channel, creating a strong confluence zone. A controlled pullback into this area followed by renewed buying pressure would be consistent with a healthy retest rather than a deterioration of the main trend.
The broader unfilled price gap between approximately **$400 and $430** represents the secondary support zone. If the first gap and the rising channel support fail, price may be drawn toward this lower imbalance area. The upper section near $425–$430 would be the first possible reaction point, while a full gap-fill could extend the correction toward **$400–$405**. A sustained break below $390 would weaken the long-term bullish structure and expose the **$350–$360 region**.
Although unfilled gaps can act as price magnets, they are not required to be closed, and no precise timing can be assigned to a potential gap-fill. As long as MSFT holds above the rising channel and the $455–$465 support zone, the primary trend remains positive. The two decisive levels are therefore **$550.64 on the upside** and approximately **$455 on the downside**.
*This analysis is for informational purposes only and does not constitute investment advice.*

คำจำกัดสิทธิ์ความรับผิดชอบ
ข้อมูลและบทความไม่ได้มีวัตถุประสงค์เพื่อก่อให้เกิดกิจกรรมทางการเงิน, การลงทุน, การซื้อขาย, ข้อเสนอแนะ หรือคำแนะนำประเภทอื่น ๆ ที่ให้หรือรับรองโดย TradingView อ่านเพิ่มเติมใน ข้อกำหนดการใช้งาน
คำจำกัดสิทธิ์ความรับผิดชอบ
ข้อมูลและบทความไม่ได้มีวัตถุประสงค์เพื่อก่อให้เกิดกิจกรรมทางการเงิน, การลงทุน, การซื้อขาย, ข้อเสนอแนะ หรือคำแนะนำประเภทอื่น ๆ ที่ให้หรือรับรองโดย TradingView อ่านเพิ่มเติมใน ข้อกำหนดการใช้งาน