
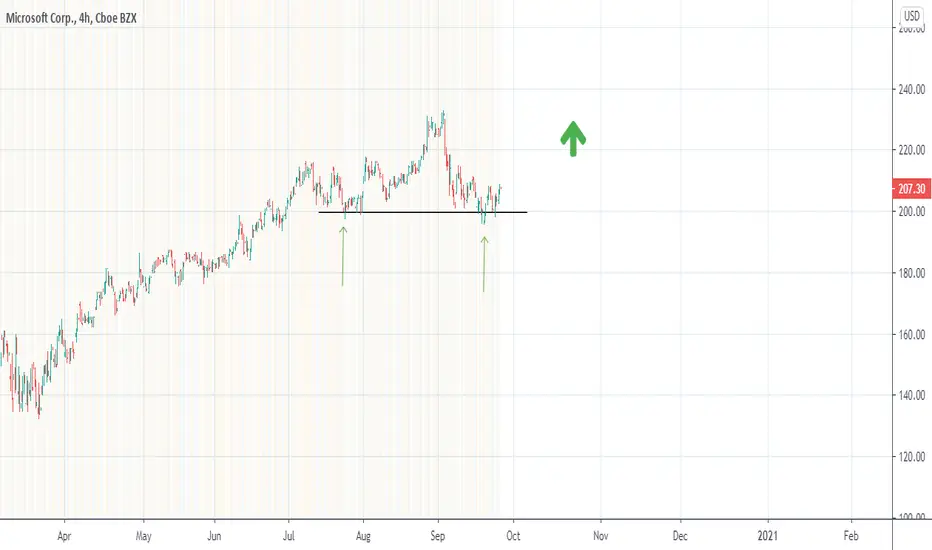
After the fall of these last weeks (fall that has occurred in all markets, not in Microsoft exclusively), a rejection at lower prices appears again (the last arrow), prices that have already been tested (in the first arrow)
Is this a double bottom pattern or is it in range?
I would say that it is a semi-range with greatly bullish connotations, personally I would open a bullish ratio straddle 2: 1
Is this a double bottom pattern or is it in range?
I would say that it is a semi-range with greatly bullish connotations, personally I would open a bullish ratio straddle 2: 1

คำจำกัดสิทธิ์ความรับผิดชอบ
ข้อมูลและบทความไม่ได้มีวัตถุประสงค์เพื่อก่อให้เกิดกิจกรรมทางการเงิน, การลงทุน, การซื้อขาย, ข้อเสนอแนะ หรือคำแนะนำประเภทอื่น ๆ ที่ให้หรือรับรองโดย TradingView อ่านเพิ่มเติมใน ข้อกำหนดการใช้งาน
คำจำกัดสิทธิ์ความรับผิดชอบ
ข้อมูลและบทความไม่ได้มีวัตถุประสงค์เพื่อก่อให้เกิดกิจกรรมทางการเงิน, การลงทุน, การซื้อขาย, ข้อเสนอแนะ หรือคำแนะนำประเภทอื่น ๆ ที่ให้หรือรับรองโดย TradingView อ่านเพิ่มเติมใน ข้อกำหนดการใช้งาน