 MSFT
MSFT Technical Analysis of MSFT:
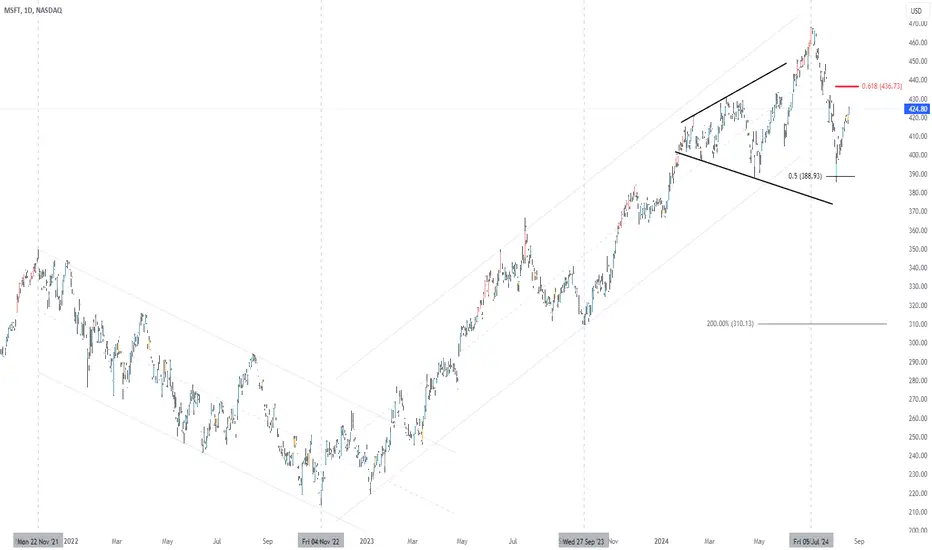
Head and Shoulders Pattern in Formation
Currently, the support established around $390 might be forming the neckline of a potential head and shoulders pattern. To complete this pattern, the right shoulder still needs to form.
Key point to watch: if the right shoulder develops below the 61.8% Fibonacci retracement level, projected at $436, it could signal a bearish move. A confirmed break of the $390 support would then be expected to trigger a downward move towards the potential target of $310.
Summary:
Current Support/Neckline Level: $390
61.8% Fibonacci Retracement Level: $436
Watch for Right Shoulder Formation Below $436
Potential Downward Target: $310
Monitor for the formation of the right shoulder and a potential break of support to validate the bearish outlook.

การนำเสนอที่เกี่ยวข้อง
คำจำกัดสิทธิ์ความรับผิดชอบ
ข้อมูลและบทความไม่ได้มีวัตถุประสงค์เพื่อก่อให้เกิดกิจกรรมทางการเงิน, การลงทุน, การซื้อขาย, ข้อเสนอแนะ หรือคำแนะนำประเภทอื่น ๆ ที่ให้หรือรับรองโดย TradingView อ่านเพิ่มเติมใน ข้อกำหนดการใช้งาน
การนำเสนอที่เกี่ยวข้อง
คำจำกัดสิทธิ์ความรับผิดชอบ
ข้อมูลและบทความไม่ได้มีวัตถุประสงค์เพื่อก่อให้เกิดกิจกรรมทางการเงิน, การลงทุน, การซื้อขาย, ข้อเสนอแนะ หรือคำแนะนำประเภทอื่น ๆ ที่ให้หรือรับรองโดย TradingView อ่านเพิ่มเติมใน ข้อกำหนดการใช้งาน