
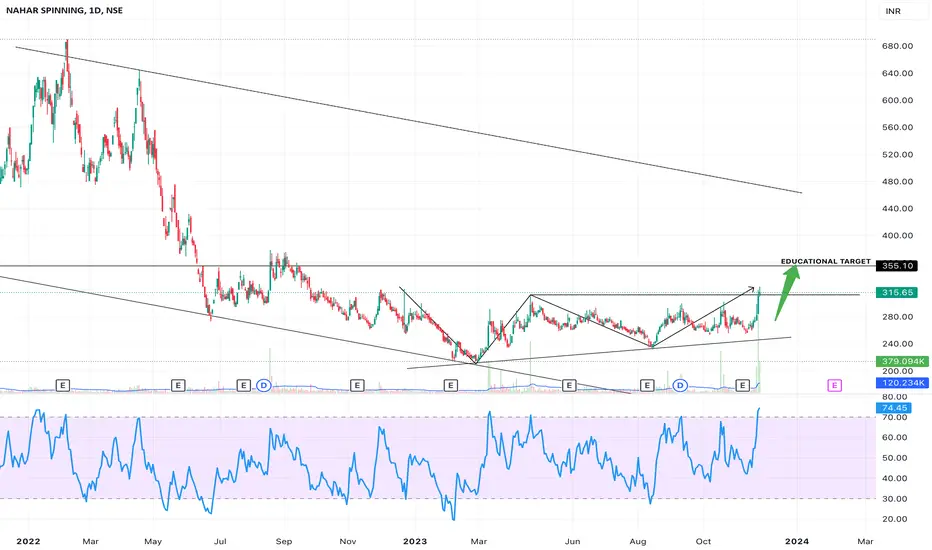
Pattern: Double Bottom pattern
The Double Bottom pattern emerges within a downtrend when the price hits two separate lows at approximately the same level. During the formation of this pattern, the volume tends to indicate a decrease in downward momentum, diminishing as the pattern develops, with a slight increase in volume at each low, typically less on the second low. Eventually, the price breaks above the highest point between the two lows, confirming a bullish signal.
PLEASE NOTE THAT:
The Double Bottom pattern emerges within a downtrend when the price hits two separate lows at approximately the same level. During the formation of this pattern, the volume tends to indicate a decrease in downward momentum, diminishing as the pattern develops, with a slight increase in volume at each low, typically less on the second low. Eventually, the price breaks above the highest point between the two lows, confirming a bullish signal.
PLEASE NOTE THAT:
- This chart analysis is only for reference purpose.
- This is not buying or selling recommendations.
- I am not SEBI registered.
- Please consult your financial advisor before taking any trade
ปิดการเทรด: ถึงเป้าหมายการทำกำไร
EDUCATIONAL TARGET CLOSED!
คำจำกัดสิทธิ์ความรับผิดชอบ
ข้อมูลและบทความไม่ได้มีวัตถุประสงค์เพื่อก่อให้เกิดกิจกรรมทางการเงิน, การลงทุน, การซื้อขาย, ข้อเสนอแนะ หรือคำแนะนำประเภทอื่น ๆ ที่ให้หรือรับรองโดย TradingView อ่านเพิ่มเติมใน ข้อกำหนดการใช้งาน
คำจำกัดสิทธิ์ความรับผิดชอบ
ข้อมูลและบทความไม่ได้มีวัตถุประสงค์เพื่อก่อให้เกิดกิจกรรมทางการเงิน, การลงทุน, การซื้อขาย, ข้อเสนอแนะ หรือคำแนะนำประเภทอื่น ๆ ที่ให้หรือรับรองโดย TradingView อ่านเพิ่มเติมใน ข้อกำหนดการใช้งาน