
📊🚀 US100 (Nasdaq) Market Structure Analysis
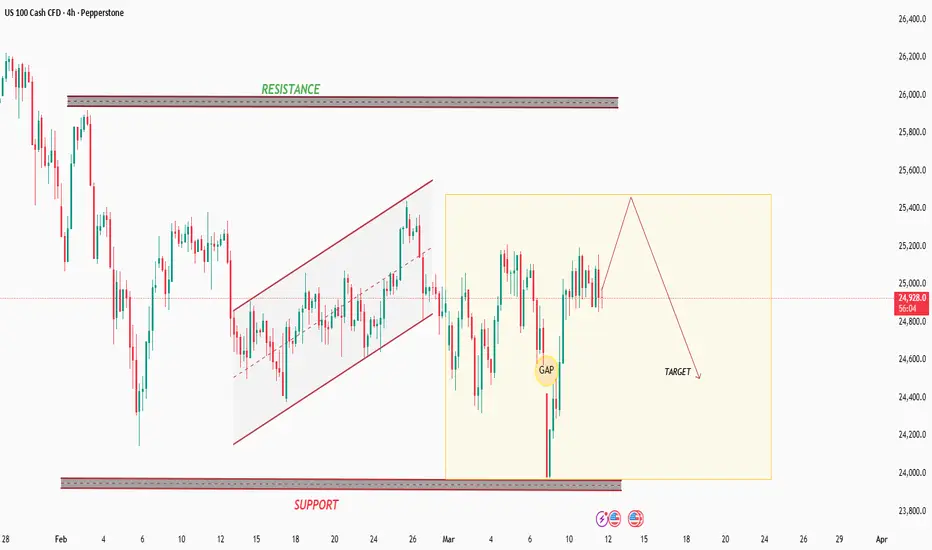
The US100 market shows a clear technical structure with key levels of support, resistance, and internal price channels. By analyzing the chart, we can see how the market has moved through different phases such as trend movement, consolidation, and volatility expansion.
📈 1. Previous Market Movement
At the beginning of the chart, the market experienced a strong bearish move, pushing price down toward the major support zone around 24,000. This level acted as a strong demand area where buyers entered the market and prevented further downside.
After touching this support level, price reacted sharply upward, confirming that the area contains significant liquidity and institutional interest.
📉 2. Rising Channel Formation
Following the bounce from support, the market started moving inside a rising channel pattern.
This channel shows:
Higher lows forming gradually
Controlled bullish momentum
Buyers slowly pushing the market upward
However, the price eventually lost momentum near the upper boundary of the channel, suggesting that buyers were becoming weaker near higher levels.
⚡ 3. Volatility and Gap Formation
Later in the chart, a sharp bearish move created a price gap.
Gaps in financial markets often indicate:
Sudden liquidity imbalance
Strong institutional orders
Market inefficiency that may be revisited later
After the drop, the market quickly recovered and moved back upward, showing high volatility and active participation from both buyers and sellers.
🧭 4. Current Market Phase
Currently, price is trading below a major resistance zone near 26,000 while holding above the key support around 24,000.
This creates a range-bound environment, meaning the market is in a decision phase where it is preparing for the next larger move.
Key observations:
Resistance is limiting upward movement
Support is still protecting the downside
Market structure shows indecision and consolidation
🎯 5. Potential Future Scenario
Based on the structure shown on the chart:
1️⃣ Price may push upward toward the resistance area.
2️⃣ If the resistance holds and sellers step in, the market could reverse downward.
3️⃣ The expected move could target lower liquidity levels near the support zone.
This scenario aligns with the projected arrow in the analysis, indicating a possible liquidity sweep followed by a bearish move toward the target area.
🧠 Conclusion
The US100 market is currently positioned between strong support and resistance levels, creating a consolidation structure. While short-term bullish attempts may continue, the presence of strong resistance suggests a potential rejection and bearish continuation toward lower targets.
Traders should monitor:
Reaction at resistance
Liquidity around the gap area
Breaks of the current range structure
These factors will determine the next major directional move in the market. 📉📊
The US100 market shows a clear technical structure with key levels of support, resistance, and internal price channels. By analyzing the chart, we can see how the market has moved through different phases such as trend movement, consolidation, and volatility expansion.
📈 1. Previous Market Movement
At the beginning of the chart, the market experienced a strong bearish move, pushing price down toward the major support zone around 24,000. This level acted as a strong demand area where buyers entered the market and prevented further downside.
After touching this support level, price reacted sharply upward, confirming that the area contains significant liquidity and institutional interest.
📉 2. Rising Channel Formation
Following the bounce from support, the market started moving inside a rising channel pattern.
This channel shows:
Higher lows forming gradually
Controlled bullish momentum
Buyers slowly pushing the market upward
However, the price eventually lost momentum near the upper boundary of the channel, suggesting that buyers were becoming weaker near higher levels.
⚡ 3. Volatility and Gap Formation
Later in the chart, a sharp bearish move created a price gap.
Gaps in financial markets often indicate:
Sudden liquidity imbalance
Strong institutional orders
Market inefficiency that may be revisited later
After the drop, the market quickly recovered and moved back upward, showing high volatility and active participation from both buyers and sellers.
🧭 4. Current Market Phase
Currently, price is trading below a major resistance zone near 26,000 while holding above the key support around 24,000.
This creates a range-bound environment, meaning the market is in a decision phase where it is preparing for the next larger move.
Key observations:
Resistance is limiting upward movement
Support is still protecting the downside
Market structure shows indecision and consolidation
🎯 5. Potential Future Scenario
Based on the structure shown on the chart:
1️⃣ Price may push upward toward the resistance area.
2️⃣ If the resistance holds and sellers step in, the market could reverse downward.
3️⃣ The expected move could target lower liquidity levels near the support zone.
This scenario aligns with the projected arrow in the analysis, indicating a possible liquidity sweep followed by a bearish move toward the target area.
🧠 Conclusion
The US100 market is currently positioned between strong support and resistance levels, creating a consolidation structure. While short-term bullish attempts may continue, the presence of strong resistance suggests a potential rejection and bearish continuation toward lower targets.
Traders should monitor:
Reaction at resistance
Liquidity around the gap area
Breaks of the current range structure
These factors will determine the next major directional move in the market. 📉📊
การซื้อขายยังคงดำเนินอยู่
✅ Trade Idea Hit Successfully
The market respected the range structure perfectly. Price moved inside the consolidation zone, filled the gap, and then followed the projected path. After rejecting the upper area, the market dropped toward the target zone near 24,400, completing the forecasted move.
📉 Result: Clean rejection → bearish continuation → target reached.

การนำเสนอที่เกี่ยวข้อง
คำจำกัดสิทธิ์ความรับผิดชอบ
ข้อมูลและบทความไม่ได้มีวัตถุประสงค์เพื่อก่อให้เกิดกิจกรรมทางการเงิน, การลงทุน, การซื้อขาย, ข้อเสนอแนะ หรือคำแนะนำประเภทอื่น ๆ ที่ให้หรือรับรองโดย TradingView อ่านเพิ่มเติมใน ข้อกำหนดการใช้งาน
การนำเสนอที่เกี่ยวข้อง
คำจำกัดสิทธิ์ความรับผิดชอบ
ข้อมูลและบทความไม่ได้มีวัตถุประสงค์เพื่อก่อให้เกิดกิจกรรมทางการเงิน, การลงทุน, การซื้อขาย, ข้อเสนอแนะ หรือคำแนะนำประเภทอื่น ๆ ที่ให้หรือรับรองโดย TradingView อ่านเพิ่มเติมใน ข้อกำหนดการใช้งาน