
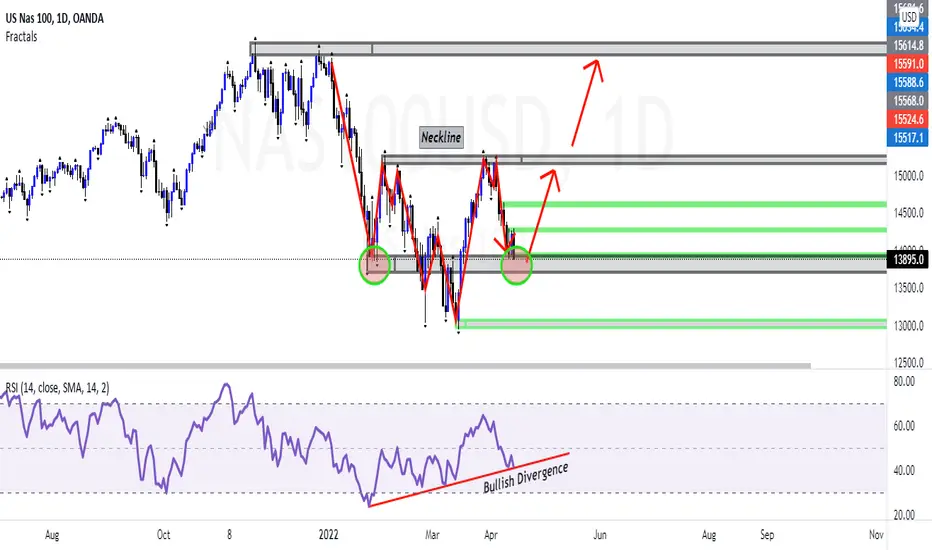
Monthly has large wicks rejecting 14000 price area. 2 months back-to-back. Monthly Bullish Engulfing as well.
Weekly candle stick analysis could be a double bottom forming or a higher low. Due to Daily analysis expecting this to be a weekly higher low.
Daily has created an inverse head & shoulder pattern with bullish divergence.
If price rejects this zone and breaks structure for turnaround of buys. Expecting price to continue pattern to upside near 15600 long term.

คำจำกัดสิทธิ์ความรับผิดชอบ
ข้อมูลและบทความไม่ได้มีวัตถุประสงค์เพื่อก่อให้เกิดกิจกรรมทางการเงิน, การลงทุน, การซื้อขาย, ข้อเสนอแนะ หรือคำแนะนำประเภทอื่น ๆ ที่ให้หรือรับรองโดย TradingView อ่านเพิ่มเติมใน ข้อกำหนดการใช้งาน
คำจำกัดสิทธิ์ความรับผิดชอบ
ข้อมูลและบทความไม่ได้มีวัตถุประสงค์เพื่อก่อให้เกิดกิจกรรมทางการเงิน, การลงทุน, การซื้อขาย, ข้อเสนอแนะ หรือคำแนะนำประเภทอื่น ๆ ที่ให้หรือรับรองโดย TradingView อ่านเพิ่มเติมใน ข้อกำหนดการใช้งาน