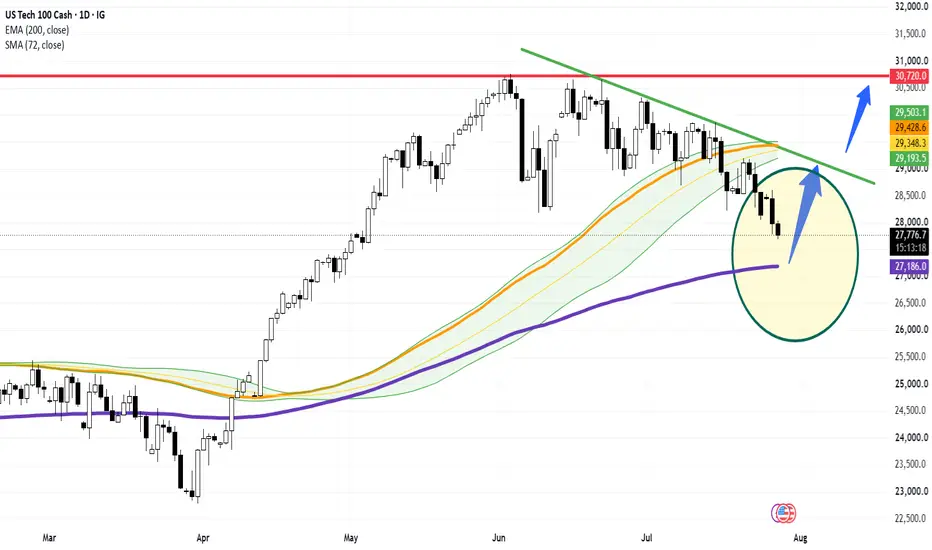
US Tech 100 ( NASDAQ) Daily: Testing 200-EMA Institutional Floor — Awaiting Bullish Trigger for Rebound Toward 30,720 Ceiling
### 🇺🇸 US Tech 100 Cash / Nasdaq (NASDAQ) Daily Technical Framework (Ref: NASDAQ_2026-07-28_08-41-12.png)
We are deploying a daily (1D) structural technical outlook on the US Tech 100 Index (NASDAQ). Following a multi-week corrective retracement from record high levels, price action is currently approaching an essential dynamic support threshold that defines the macro health of the tech-heavy benchmark.
The index is trading down today at **27,809.3 (-0.61%)**, steadily compressing toward its primary institutional floor.
---
### 🔍 Technical Architecture & Dynamic Confluence Node:
Our quantitative framework highlights a high-value demand zone marked within the highlighted yellow circle:
1. **The Institutional Floor (200-Period EMA):** The ongoing pullback is closing in on the long-term trend baseline at the **200-period EMA (purple line sitting at 27,186.3)**. Historically, this dynamic average serves as a primary institutional accumulation zone during major bull market pullbacks.
2. **The Dynamic Overhead Resistance Gauntlet:** Above current price action, initial recovery momentum will encounter resistance at the **72-period SMA ribbon cluster (tracked between 29,193.5 and 29,503.2)**, which aligns directly with the upper descending trendline (green LTB).
3. **Macro Target Ceiling (30,720.0):** The primary horizontal structural resistance remains firmly anchored at **30,720.0** (red horizontal line).
---
### 🚀 Projected Bullish Impulse Pathways (Blue Vectors):
We are awaiting a clear price action confirmation trigger (such as a strong bullish rejection candle or engulfing pattern) off the 200-EMA zone to validate the upside trajectory:
* **Trigger Condition:** Confirmation of buy-side absorption and daily closing strength near the **27,186.3** EMA 200 floor.
* **Vector 1 (Intermediate Rebound Target):** The initial recovery impulse (first blue vector) targets a retest of the descending green trendline and the **72-SMA ribbon zone (29,193.5 – 29,503.2)**.
* **Vector 2 (Macro Top Expansion):** A decisive breakout above the 29,500 moving average barrier clears the structural corridor for a secondary impulse leg (second blue vector) aiming directly for the **30,720.0** structural ceiling.
### 📊 Tactical Parameters Summary:
* **Current Bias:** Neutral / Awaiting Bullish Confirmation at Support
* **Institutional Demand Floor:** 27,186.3 (200-EMA Anchor)
* **Primary Dynamic Resistance (72-SMA / LTB):** 29,193.5 – 29,503.2
* **Macro Profit Target Ceiling:** 30,720.0
---
📊 **ChartPro Data**
*Tech Equity Architecture, Dynamic Support Sourcing & Systematic Risk Management.*
⚠️ **Disclaimer:** For educational and informational purposes only. This active market study represents a personal trading framework and does not constitute financial or investment advice.
NASDAQ) Daily: Testing 200-EMA Institutional Floor — Awaiting Bullish Trigger for Rebound Toward 30,720 Ceiling### 🇺🇸 US Tech 100 Cash / Nasdaq (
NASDAQ) Daily Technical Framework (Ref: NASDAQ_2026-07-28_08-41-12.png)We are deploying a daily (1D) structural technical outlook on the US Tech 100 Index (
NASDAQ). Following a multi-week corrective retracement from record high levels, price action is currently approaching an essential dynamic support threshold that defines the macro health of the tech-heavy benchmark.The index is trading down today at **27,809.3 (-0.61%)**, steadily compressing toward its primary institutional floor.
---
### 🔍 Technical Architecture & Dynamic Confluence Node:
Our quantitative framework highlights a high-value demand zone marked within the highlighted yellow circle:
1. **The Institutional Floor (200-Period EMA):** The ongoing pullback is closing in on the long-term trend baseline at the **200-period EMA (purple line sitting at 27,186.3)**. Historically, this dynamic average serves as a primary institutional accumulation zone during major bull market pullbacks.
2. **The Dynamic Overhead Resistance Gauntlet:** Above current price action, initial recovery momentum will encounter resistance at the **72-period SMA ribbon cluster (tracked between 29,193.5 and 29,503.2)**, which aligns directly with the upper descending trendline (green LTB).
3. **Macro Target Ceiling (30,720.0):** The primary horizontal structural resistance remains firmly anchored at **30,720.0** (red horizontal line).
---
### 🚀 Projected Bullish Impulse Pathways (Blue Vectors):
We are awaiting a clear price action confirmation trigger (such as a strong bullish rejection candle or engulfing pattern) off the 200-EMA zone to validate the upside trajectory:
* **Trigger Condition:** Confirmation of buy-side absorption and daily closing strength near the **27,186.3** EMA 200 floor.
* **Vector 1 (Intermediate Rebound Target):** The initial recovery impulse (first blue vector) targets a retest of the descending green trendline and the **72-SMA ribbon zone (29,193.5 – 29,503.2)**.
* **Vector 2 (Macro Top Expansion):** A decisive breakout above the 29,500 moving average barrier clears the structural corridor for a secondary impulse leg (second blue vector) aiming directly for the **30,720.0** structural ceiling.
### 📊 Tactical Parameters Summary:
* **Current Bias:** Neutral / Awaiting Bullish Confirmation at Support
* **Institutional Demand Floor:** 27,186.3 (200-EMA Anchor)
* **Primary Dynamic Resistance (72-SMA / LTB):** 29,193.5 – 29,503.2
* **Macro Profit Target Ceiling:** 30,720.0
---
📊 **ChartPro Data**
*Tech Equity Architecture, Dynamic Support Sourcing & Systematic Risk Management.*
⚠️ **Disclaimer:** For educational and informational purposes only. This active market study represents a personal trading framework and does not constitute financial or investment advice.

คำจำกัดสิทธิ์ความรับผิดชอบ
ข้อมูลและบทความไม่ได้มีวัตถุประสงค์เพื่อก่อให้เกิดกิจกรรมทางการเงิน, การลงทุน, การซื้อขาย, ข้อเสนอแนะ หรือคำแนะนำประเภทอื่น ๆ ที่ให้หรือรับรองโดย TradingView อ่านเพิ่มเติมใน ข้อกำหนดการใช้งาน
คำจำกัดสิทธิ์ความรับผิดชอบ
ข้อมูลและบทความไม่ได้มีวัตถุประสงค์เพื่อก่อให้เกิดกิจกรรมทางการเงิน, การลงทุน, การซื้อขาย, ข้อเสนอแนะ หรือคำแนะนำประเภทอื่น ๆ ที่ให้หรือรับรองโดย TradingView อ่านเพิ่มเติมใน ข้อกำหนดการใช้งาน