nasdaq100....h
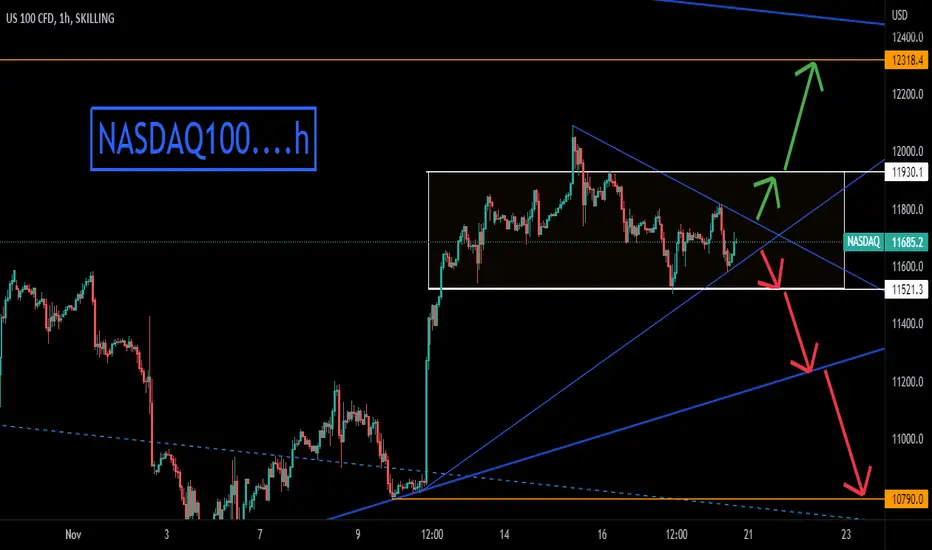
= Nasdaq analysis on the hourly chart
= The analysis is based on trend analysis, support and resistance
= Currently, it is on an occasional path between support and resistance.. breaking it goes to the selling targets... and exceeding it goes to the buying targets
= The analysis is based on trend analysis, support and resistance
= Currently, it is on an occasional path between support and resistance.. breaking it goes to the selling targets... and exceeding it goes to the buying targets

คำจำกัดสิทธิ์ความรับผิดชอบ
ข้อมูลและบทความไม่ได้มีวัตถุประสงค์เพื่อก่อให้เกิดกิจกรรมทางการเงิน, การลงทุน, การซื้อขาย, ข้อเสนอแนะ หรือคำแนะนำประเภทอื่น ๆ ที่ให้หรือรับรองโดย TradingView อ่านเพิ่มเติมใน ข้อกำหนดการใช้งาน
คำจำกัดสิทธิ์ความรับผิดชอบ
ข้อมูลและบทความไม่ได้มีวัตถุประสงค์เพื่อก่อให้เกิดกิจกรรมทางการเงิน, การลงทุน, การซื้อขาย, ข้อเสนอแนะ หรือคำแนะนำประเภทอื่น ๆ ที่ให้หรือรับรองโดย TradingView อ่านเพิ่มเติมใน ข้อกำหนดการใช้งาน